
Page 20 - JCTR-10-2
P. 20
114 Jangid et al. | Journal of Clinical and Translational Research 2024; 10(2): 112-118
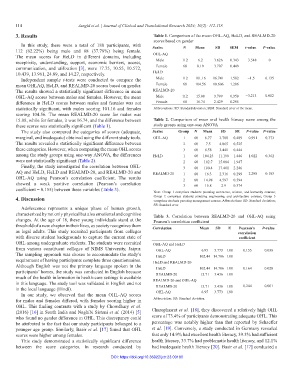
3. Results Table 1. Comparison of the mean OHL-AQ, HeLD, and REALMD-20
scores based on gender
In this study, there were a total of 180 participants, with Scales N Mean SD SEM t‑value P‑value
112 (62.22%) being male and 68 (37.78%) being female. OHL-AQ
The mean scores for HeLD in different domains, including Male 112 6.2 3.626 0.343 −3.548 0
receptivity, understanding, support, economic barriers, access,
communication, and utilization [3], were 17.75, 10.55, 10.572, Female 68 8.19 3.707 0.449
10.439, 13.961, 24.89, and 14.27, respectively. HeLD
Independent sample t-tests were conducted to compare the Male 112 101.16 16.741 1.582 −1.5 0.135
mean OHLAQ, HeLD, and REALMD-20 scores based on gender. Female 68 104.56 10.606 1.286
The results showed a statistically significant difference in mean REALMD-20
OHL-AQ scores between males and females. However, the mean Male 112 15.08 3.799 0.359 −3.213 0.002
difference in HeLD scores between males and females was not Female 68 16.74 2.429 0.295
statistically significant, with males scoring 101.16 and females Abbreviations: SD: Standard deviation; SEM: Standard error of the mean.
scoring 104.56. The mean REALMD-20 score for males was
15.08, while for females, it was 16.74, and the difference between Table 2. Comparison of mean oral health literacy score among the
these scores was statistically significant (Table 1). study groups using one-way ANOVA
The study also compared the categories of scores (adequate, Scales Group N Mean SD SE F‑value P‑value
marginal, and inadequate) obtained using the different study tools. OHL-AQ 1 60 6.77 3.788 0.489 0.991 0.373
The results revealed a statistically significant difference between 2 60 7.5 4.065 0.525
these categories. However, when comparing the mean OHL scores 3 60 6.58 3.441 0.444
among the study groups using one-way ANOVA, the differences HeLD 1 60 104.23 11.198 1.446 1.022 0.362
were not statistically significant (Table 2). 2 60 102.7 15.084 1.947
Finally, the study investigated the correlation between OHL- 3 60 100.4 17.401 2.246
AQ and HeLD, HeLD and REALMD-20, and REALMD-20 and REALMD-20 1 60 16.3 2.316 0.299 2.298 0.103
OHL-AQ using Pearson’s correlation coefficient. The results 2 60 14.98 4.597 0.594
showed a weak positive correlation (Pearson’s correlation 3 60 15.8 2.9 0.374
coefficient = 0.155) between these variables (Table 3).
Note: Group 1 comprises students pursuing commerce, science, and humanity courses;
4. Discussion Group 2 comprises students pursuing engineering and architecture courses; Group 3
comprises students pursuing management courses. Abbreviations: SD: Standard deviation;
SE: Standard error.
Adolescence represents a unique phase of human growth,
characterized by not only physical but also emotional and cognitive Table 3. Correlation between REALMD-20 and OHL-AQ using
changes. At the age of 18, these young individuals stand at the Pearson’s correlation coefficient
threshold of a new chapter in their lives, as society recognizes them Correlation Mean SD N Pearson’s P‑value
as legal adults. This study recruited participants from colleges correlation
with diverse student backgrounds to capture the current state of coefficient
OHL among undergraduate students. The students were recruited OHL-AQ and HeLD
from various constituent colleges of NIMS University, Jaipur. OHL-AQ 6.95 3.773 180 0.155 0.038
The sampling approach was chosen to accommodate the study’s HeLD 102.44 14.786 180
requirement of having participants complete three questionnaires. HeLD and REALMD-20
Although English was not the primary language spoken in the HeLD 102.44 14.786 180 0.164 0.028
participants’ homes, the study was conducted in English because REALMD-20 15.71 3.436 180
much of the health information in health-care settings is available REALMD-20 and OHL-AQ
in this language. The study tool was validated in English and not REALMD-20 15.71 3.436 180 0.244 0.001
in the local language (Hindi). OHL-AQ 6.95 3.773 180
In our study, we observed that the mean OHL-AQ scores
for males and females differed, with females scoring higher in Abbreviation: SD: Standard deviation.
OHL. This finding contrasts with a study by Chowdhary et al.
(2016) [16] in South India and Naghibi Sistani et al. (2014) [5] Charophasrat et al. [18], they discovered a relatively high OHL
who found no gender difference in OHL. This discrepancy could score of 73.4% of participants demonstrating adequate OHL. This
be attributed to the fact that our study participants belonged to a percentage was notably higher than that reported by Schaeffer
younger age group. Similarly, Basir et al. [17] found that OHL et al. [19]. Conversely, a study conducted in Germany revealed
scores were higher among females. that only 14.9% had excellent health literacy, 39.3% had sufficient
This study demonstrated a statistically significant difference health literacy, 33.7% had problematic health literacy, and 12.1%
between the score categories. In research conducted by had inadequate health literacy [20]. Basir et al. [17] conducted a
DOI: https://doi.org/10.36922/jctr.23.00100