
Page 8 - JCTR-9-4
P. 8
224 AboEl-Azm et al. | Journal of Clinical and Translational Research 2023; 9(4): 222-235
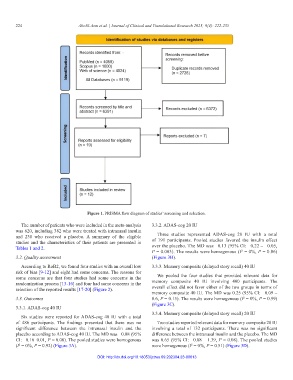
Figure 1. PRISMA flow diagram of studies’ screening and selection.
The number of patients who were included in the meta-analysis 3.3.2. ADAS-cog 20 IU
was 620, including 382 who were treated with intranasal insulin
and 238 who received a placebo. A summary of the eligible Three studies represented ADAS-cog 20 IU with a total
studies and the characteristics of their patients are presented in of 191 participants. Pooled studies favored the insulin effect
Tables 1 and 2. over the placebo. The MD was −0.13 (95% CI: −0.22 – −0.05,
P = 0.003). The results were homogenous (I = 0%, P = 0.86)
2
3.2. Quality assessment (Figure 3B).
According to RoB2, we found four studies with an overall low 3.3.3. Memory composite (delayed story recall) 40 IU
risk of bias [9-12] and eight had some concerns. The reasons for
some concerns are that four studies had some concerns in the We pooled the four studies that provided relevant data for
randomization process [13-16] and four had some concerns in the memory composite 40 IU involving 400 participants. The
selection of the reported results [17-20] (Figure 2). overall effect did not favor either of the two groups in terms of
memory composite 40 IU. The MD was 0.25 (95% CI: −0.09 –
3.3. Outcomes 0.6, P = 0.15). The results were homogenous (I = 0%, P = 0.99)
2
(Figure 3C).
3.3.1. ADAS-cog 40 IU
3.3.4. Memory composite (delayed story recall) 20 IU
Six studies were reported for ADAS-cog 40 IU with a total
of 486 participants. The findings presented that there was no Two studies reported relevant data for memory composite 20 IU
significant difference between the intranasal insulin and the involving a total of 132 participants. There was no significant
placebo according to ADAS-cog 40 IU. The MD was −0.08 (95% difference between the intranasal insulin and the placebo. The MD
CI: −0.16–0.01, P = 0.08). The pooled studies were homogenous was 0.65 (95% CI: −0.08 – 1.39, P = 0.08). The pooled studies
(I = 0%, P = 0.92) (Figure 3A). were homogenous (I = 0%, P = 0.51) (Figure 3D).
2
2
DOI: http://dx.doi.org/10.18053/jctres.09.202304.23-00013