
Page 134 - MI-2-4
P. 134
Microbes & Immunity Oxidative toxicity and folate in HIV on DTG-ART
controls was younger adults aged 19–28 years (64.9%), only a minimal short-term effect of DTG initiation on
the largest proportion of PLWH on DTG-based ART were folate status.
in the 39–48 age category (37.8%), suggesting that HIV- However, when compared with HIV-negative controls,
positive individuals tended to be older. who had substantially higher folate levels (11.11 ±
Educational attainment was comparable between 1.31 ng/mL), both pre- and post-treatment HIV-positive
groups (p=0.715), with secondary education being the participants exhibited severe folate depletion (p<0.001).
most frequent, followed by tertiary and primary education. This pattern highlights that folate deficiency is a persistent
Socioeconomic status was also similar (p=0.601), with feature of HIV infection, independent of immediate DTG
over 70% of participants in both groups classified as low- exposure.
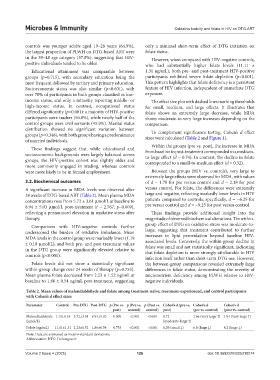
income status, and only a minority reporting middle- or The effect size plot with dashed lines marking thresholds
high-income status. In contrast, occupational status for small, medium, and large effects. It illustrates that
differed significantly (p=0.001): a majority of HIV-positive folate shows an extremely large decrease, while MDA
participants were traders (56.8%), while nearly half of the shows moderate-to-very large increases depending on the
control groups were civil servants (45.9%). Marital status comparison.
distribution showed no significant variation between To complement significance testing, Cohen’s d effect
groups (p=0.348), with both groups having a predominance sizes were calculated (Table 2 and Figure 1).
of married individuals.
Within the groups (pre vs. post), the increase in MDA
These findings suggest that, while educational and from baseline to post-treatment corresponded to a medium-
socioeconomic backgrounds were largely balanced across to-large effect (d = 0.74). In contrast, the decline in folate
groups, the HIV-positive cohort was slightly older and corresponded to a small-to-medium effect (d = 0.32).
more commonly engaged in trading, whereas controls
were more likely to be in formal employment. Between the groups (HIV vs. controls), very large to
extremely large effects were observed for MDA, with values
3.2. Biochemical outcomes of d = 1.78 for pre versus control and d = 2.18 for post
A significant increase in MDA levels was observed after versus control. For folate, the differences were extremely
24 weeks of DTG-based ART (Table 2). Mean plasma MDA large and negative, reflecting markedly lower levels in HIV
concentrations rose from 5.72 ± 3.61 µmol/L at baseline to patients compared to controls; specifically, d = −6.25 for
8.94 ± 5.03 µmol/L post-treatment (t = 2.767, p=0.009), pre versus control and d = −9.25 for post versus control.
reflecting a pronounced elevation in oxidative stress after These findings provide additional insight into the
therapy. magnitude of observed biochemical alterations. The within-
Comparison with HIV-negative controls further group effect of DTG on oxidative stress was moderate-to-
underscored the burden of oxidative imbalance. Mean large, suggesting that treatment contributed to further
MDA levels in the control group were markedly lower (1.19 increases in lipid peroxidation beyond baseline HIV-
± 0.18 µmol/L), and both pre- and post-treatment values associated levels. Conversely, the within-group decline in
folate was small and not statistically significant, indicating
in the DTG group were significantly elevated relative to that folate depletion is more strongly attributable to HIV
controls (p<0.001).
infection itself rather than short-term DTG use. However,
Folate levels did not show a statistically significant the between-group comparisons revealed extremely large
within-group change over 24 weeks of therapy (p=0.753). differences in folate status, demonstrating the severity of
Mean plasma folate decreased from 2.23 ± 1.52 ng/mL at micronutrient deficiency among PLWH relative to HIV-
baseline to 1.86 ± 0.54 ng/mL post-treatment, suggesting negative individuals.
Table 2. Mean values of malondialdehyde and folate among treatment‑naïve, treatment‑experienced, and control participants
with Cohen’s d effect sizes
Parameter Control Pre‑DTG Post‑DTG p (Pre vs. p (Pre vs. p (Post vs. Cohen’s d (pre vs. Cohen’s d Cohen’s d
post) control) control) post) (pre vs. control) (post vs. control)
Malondialdehyde 1.19±0.18 5.72±3.61 8.94±5.03 0.009 <0.001 <0.001 0.72 1.66 (very large ↑) 1.94 (very large ↑)
(µmol/L) (moderate-large ↑)
Folate (ng/mL) 11.11±1.31 2.23±1.52 1.86±0.54 0.753 <0.001 <0.001 0.29 (small ↓) 6.8 (huge ↓) 8.2 (huge ↓)
Note: Data are expressed as means±standard deviations.
Abbreviation: DTG: Dolutegravir.
Volume 2 Issue 4 (2025) 126 doi: 10.36922/MI025310074