
Page 37 - MSAM-3-1
P. 37
Materials Science in Additive Manufacturing Carbon addition in IN738LC
A 1 B 1 C 1
A 2 B 2 C 2
A B C
3 3 3
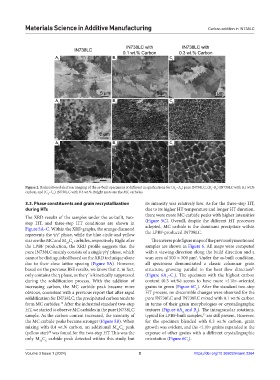
Figure 2. Backscattered electron imaging of the as-built specimens at different magnifications for (A –A ) pure IN738LC, (B –B ) IN738LC with 0.1 wt.%
3
1
3
1
carbon, and (C –C ) IN738LC with 0.3 wt.%. Bright spots are the MC carbides.
3
1
3.3. Phase constituents and grain recrystallization its intensity was relatively low. As for the three-step HT,
during HTs due to its higher HT temperature and longer HT duration,
The XRD results of the samples under the as-built, two- there were more MC carbide peaks with higher intensities
step HT, and three-step HT conditions are shown in (Figure 5C). Overall, despite the different HT processes
Figure 5A–C. Within the XRD graphs, the orange diamond adopted, MC carbide is the dominant precipitate within
represents the γ/γ’ phase, while the blue circle and yellow the LPBF-produced IN738LC.
star are the MC and M C carbides, respectively. Right after The inverse pole figure maps of the previously mentioned
6
23
the LPBF production, the XRD profile suggests that the samples are shown in Figure 6. All maps were computed
pure IN738LC mainly consists of a single γ/γ’ phase, which with a viewing direction along the build direction and a
cannot be distinguished based on the XRD technique alone scan area of 500 × 500 μm . Under the as-built condition,
2
due to their close lattice spacing (Figure 5A). However, all specimens demonstrated a classic columnar grain
31
based on the previous BSE results, we know that it, in fact, structure, growing parallel to the heat flow direction
only contains the γ phase, as the γ’ is kinetically suppressed (Figure 6A –C ). The specimen with the highest carbon
1
1
during the solidification process. With the addition of content (0.3 wt.%) seems to have more <110>-oriented
increasing carbon, the MC carbide peak became more grains in green (Figure 6C ). After the standard two-step
1
obvious, consistent with a previous report that after rapid HT process, no discernible changes were observed for the
solidification for IN738LC, the precipitated carbon tends to pure IN738LC and IN738LC mixed with 0.1 wt.% carbon
form MC carbides. After the industrial standard two-step in terms of their grain morphologies or crystallographic
13
HT, we started to observe MC carbides in the pure IN738LC textures (Figure 6A and B ). The intragranular rotations,
2
2
sample. As the carbon content increased, the intensity of typical for LPBF-built samples, are still present. However,
32
the MC carbide peaks became stronger (Figure 5B). When for the specimen blended with 0.3 wt.% carbon, grain
mixing with 0.4 wt.% carbon, an additional M C peak growth was evident, and the <110> grains expanded at the
23
6
(yellow star) was found for the two-step HT. This was the expense of other grains with a different crystallographic
30
only M C carbide peak detected within this study, but orientation (Figure 6C ).
23
2
6
Volume 3 Issue 1 (2024) 5 https://doi.org/10.36922/msam.2264