
Page 69 - MSAM-3-2
P. 69
Materials Science in Additive Manufacturing Mechanical properties of NiTi TPMS
the LPBF process, leading to excessive Ti precipitation The DSC curves of the aging samples and the analysis
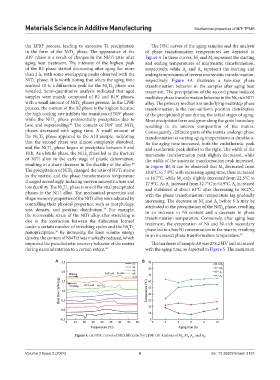
in the form of the NiTi phase. The appearance of the of phase transformation temperatures are depicted in
2
B19’ phase is a result of changes in the Ni/Ti ratio after Figure 4. In these curves, M and M represent the starting
f
s
aging heat treatment. The intensity of the highest peak and ending temperatures of martensitic transformation,
of the B2 phase started decreasing after aging for more respectively, while A and A represent the starting and
s
f
than 2 h, with some overlapping peaks observed with the ending temperatures of reverse martensitic transformation,
NiTi phase. It is worth noting that when the aging time respectively. Figure 4A illustrates a two-step phase
2
reached 10 h, a diffraction peak for the Ni Ti phase was transformation behavior in the samples after aging heat
3
4
revealed. Semi-quantitative analysis indicated that aged treatment. The precipitation of the second phase induced
samples were mainly composed of B2 and B19’ phases, multistep phase transformation behavior in the Ni-rich NiTi
with a small amount of NiTi phases present. In the LPBF alloy. The primary mechanism underlying multistep phase
2
process, the content of the B2 phase is the highest because transformation is the non-uniform position distribution
the high cooling rate inhibits the transition of B19’ phase, of the precipitated phase during the initial stages of aging.
while the NiTi phase preferentially precipitates due to Most precipitates form and grow along the grain boundary,
2
heat and supercooling. The content of B19’ and NiTi resulting in an uneven composition of the matrix.
43
2
phases decreased with aging time. A small amount of Consequently, different parts of the matrix undergo phase
the Ni Ti phase appeared in the A10 sample, indicating transformation at varying aging temperatures or durations.
4
3
that the second phase was almost completely dissolved, As the aging time increased, both the endothermic peak
and the Ni Ti phase began to precipitate between 8 and and exothermic peak shifted to the right. The width of the
4
3
10 h. As a brittle phase, the NiTi phase led to the fracture martensite transformation peak slightly decreased, while
2
of NiTi alloy in the early stage of plastic deformation, the width of the austenite transformation peak increased.
resulting in a sharp decrease in the ductility of the alloy. In Figure 4B, it can be observed that M decreased from
44
The precipitation of NiTi changed the ratio of Ni/Ti atoms 18.6°C to 7.9°C with increasing aging time, then increased
f
2
in the matrix, and the phase transformation temperature to 16.7°C, while M only slightly increased from 22.5°C to
s
changed accordingly, inducing uneven microstructure and 27.9°C. As A increased from 32.7°C to 54.9°C, A increased
s
low ductility. The Ni Ti phase is one of the vital precipitated and stabilized at about 63°C after decreasing to 58.2°C,
f
4
3
phases in the NiTi alloy. The mechanical properties and with the phase transformation temperature lag gradually
shape memory properties of the NiTi alloy were adjusted by increasing. The decrease in M and A before 6 h may be
controlling their physical properties, such as morphology, attributed to the precipitation of the NiTi phase, resulting
f
f
size, density, and position distribution. For example, in an increase in Ni content and a decrease in phase
2
45
the recoverable strain of the NiTi alloy after stretching is transformation temperature. Conversely, after aging heat
due to the interaction between the dislocation formed treatment, the evaporation of Ni and Ni-rich secondary
under a certain number of stretching cycles and the Ni Ti phase led to a low Ni concentration in the matrix, resulting
4
3
nanoprecipitate. By increasing the laser volume energy in an increased phase transformation temperature. 47
36
density, the content of Ni4Ti3 was markedly reduced, which
improved the pseudoelastic recovery behavior of the matrix The hardness of sample A0 was 278.2 HV and increased
during nanoindentation to a certain extent. 46 with the aging time, as depicted in Figure 5. The maximum
A B
Figure 4. (A) DSC curves of NiTi fabricated by LPBF. (B) Analysis of M , M , A , and A .
s f s f
Volume 3 Issue 2 (2024) 6 doi: 10.36922/msam.3137