
Page 67 - MSAM-3-2
P. 67
Materials Science in Additive Manufacturing Mechanical properties of NiTi TPMS
Table 1. The processing parameter for laser powder bed 15 cycles. After the cycles, the sample was heated in a water
fusion bath at 100°C for 3 min. The ratio of height changes before
and after heating to the original height was measured, and
Parameters Value
the shape memory recovery ratio (η) was calculated using
Laser power (W) 240 Equation II. The loading and unloading speeds were both
Laser speed (mm/s) 600 set at 0.5 mm/min.
Hatch spacing (mm) 0.1 η = (h −h )/(h −h )×100% (II)
Layer thickness (mm) 0.03 3 2 2 1
Remelting power (W) 60 where h is the height of the sample before testing, h is
1
2
Remelting speed (mm/s) 200 the height of the sample after the end of the cycle, and h is
3
the height of the sample after heating, all in mm.
Microhardness of the aged samples was measured using
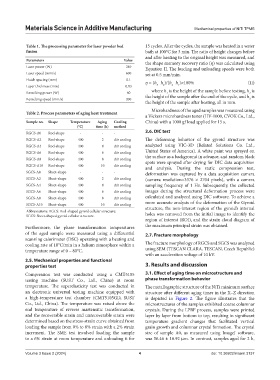
Table 2. Process parameters of aging heat treatment
a Vickers microhardness tester (HV-1000, CVOK Co., Ltd.,
Sample no. Shape Temperature Aging Cooling China) with a 1000 gf load applied for 15 s.
(°C) time (h) method
RGCS-A0 Rod-shape - - - 2.6. DIC test
RGCS-A2 Rod-shape 400 2 Air cooling The deforming behavior of the gyroid structure was
RGCS-A4 Rod-shape 400 4 Air cooling analyzed using VIC-3D (Related Solutions Co. Ltd.,
RGCS-A6 Rod-shape 400 6 Air cooling United States of America). A white paint was sprayed on
RGCS-A8 Rod-shape 400 8 Air cooling the surface as a background in advance, and random black
spots were sprayed after drying for DIC data acquisition
RGCS-A10 Rod-shape 400 10 Air cooling and analysis. During the static compression test,
SGCS-A0 Sheet-shape - - - deformation was captured by a data acquisition camera
SGCS-A2 Sheet-shape 400 2 Air cooling (camera resolution=3376 × 2704 pixels), with a camera
SGCS-A4 Sheet-shape 400 4 Air cooling sampling frequency of 1 Hz. Subsequently, the collected
SGCS-A6 Sheet-shape 400 6 Air cooling images during the structural deformation process were
SGCS-A8 Sheet-shape 400 8 Air cooling calculated and analyzed using DIC software. To achieve a
SGCS-A10 Sheet-shape 400 10 Air cooling more accurate analysis of the deformation of the Gyroid
Abbreviations: RGCS: Rod-shaped gyroid cellular structure; structure, the non-interest region of the gyroid’s internal
SGCS: Sheet-shaped gyroid cellular structure. holes was removed from the initial image to identify the
region of interest (ROI), and the strain cloud diagram of
Furthermore, the phase transformation temperatures the maximum principal strain was obtained.
of the aged sample were measured using a differential 2.7. Fracture morphology
scanning calorimeter (DSC) operating with a heating and
cooling rate of 10°C/min in a helium atmosphere within a The fracture morphology of RGCS and SGCS was analyzed
temperature range of 0 – 80°C. using SEM (TESCAN CLARA, TESCAN, Czech Republic)
with an acceleration voltage of 10 kV.
2.5. Mechanical properties and functional
properties test 3. Results and discussion
Compression test was conducted using a CMT5105 3.1. Effect of aging time on microstructure and
testing machine (SUST Co., Ltd., China) at room phase transformation behavior
temperature. The superelasticity test was conducted in The metallographic structure of the NiTi minimum surface
an electronic universal testing machine equipped with structure after different aging times in the X–Z direction
a high-temperature test chamber (CMT5105GD, SUST is depicted in Figure 2. The figure illustrates that the
Co., Ltd., China). The temperature was raised above the microstructures of the samples exhibited coarse columnar
end temperature of reverse martensitic transformation, crystals. During the LPBF process, samples were printed
and the recoverable strain and unrecoverable strain were layer by layer from bottom to top, resulting in significant
determined based on the stress-strain curve obtained from temperature gradient changes that facilitated vertical
loading the sample from 0% to 8% strain with a 2% strain grain growth and columnar crystal formation. The crystal
increment. The SME test involved loading the sample size of sample A0, as measured using ImageJ software,
to a 6% strain at room temperature and unloading it for was 56.46 ± 10.92 µm. In contrast, samples aged for 2 h,
Volume 3 Issue 2 (2024) 4 doi: 10.36922/msam.3137