
Page 75 - MSAM-3-2
P. 75
Materials Science in Additive Manufacturing Mechanical properties of NiTi TPMS
Figure 10. (Continued).
A B C
D E F
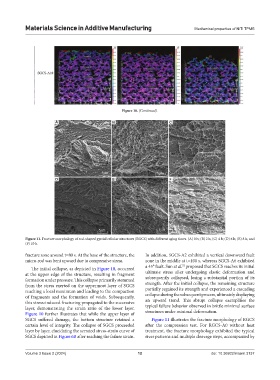
Figure 11. Fracture morphology of rod-shaped gyroid cellular structures (RGCS) with different aging times. (A) 0 h; (B) 2 h; (C) 4 h; (D) 6 h; (E) 8 h; and
(F) 10 h.
fracture zone around t=80 s. At the base of the structure, the In addition, SGCS-A2 exhibited a vertical downward fault
micro-rod was bent upward due to compressive stress. zone in the middle at t=100 s, whereas SGCS-A6 exhibited
52
The initial collapse, as depicted in Figure 10, occurred a 45° fault. Sun et al. proposed that SGCS reaches its initial
at the upper edge of the structure, resulting in fragment ultimate stress after undergoing elastic deformation and
formation under pressure. This collapse primarily stemmed subsequently collapsed, losing a substantial portion of its
from the stress exerted on the uppermost layer of SGCS strength. After the initial collapse, the remaining structure
reaching a local maximum and leading to the compaction partially regained its strength and experienced a cascading
of fragments and the formation of voids. Subsequently, collapse during the subsequent process, ultimately displaying
this stress-induced fracturing propagated to the successive an upward trend. This abrupt collapse exemplifies the
layer, demonstrating the strain ratio of the lower layer. typical failure behavior observed in brittle minimal surface
Figure 10 further illustrates that while the upper layer of structures under minimal deformation.
SGCS suffered damage, the bottom structure retained a Figure 11 illustrates the fracture morphology of RGCS
certain level of integrity. The collapse of SGCS proceeded after the compression test. For RGCS-A0 without heat
layer by layer, elucidating the serrated stress-strain curve of treatment, the fracture morphology exhibited the typical
SGCS depicted in Figure 6B after reaching the failure strain. river patterns and multiple cleavage steps, accompanied by
Volume 3 Issue 2 (2024) 12 doi: 10.36922/msam.3137