
Page 119 - OR-1-1
P. 119
Appendix
A B
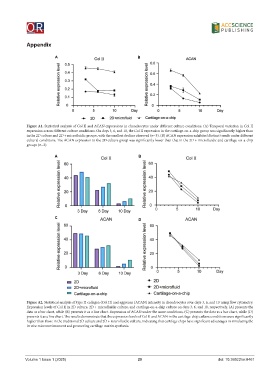
Figure A1. Statistical analysis of Col II and ACAN expressions in chondrocytes under different culture conditions. (A) Temporal variation in Col II
expression across different culture conditions. On days 3, 6, and 10, the Col II expression in the cartilage-on-a-chip group was significantly higher than
in the 2D culture and 2D + microfluidic groups, with the smallest decline observed (n=3). (B) ACAN expression exhibited distinct trends under different
cultural conditions. The ACAN expression in the 2D culture group was significantly lower than that in the 2D + microfluidic and cartilage-on-a-chip
groups (n=3).
A B
C
D
Figure A2. Statistical analysis of type II collagen (Col II) and aggrecan (ACAN) intensity in chondrocytes over days 3, 6, and 10 using flow cytometry.
Expression levels of Col II in 2D culture, 2D + microfluidic culture, and cartilage-on-a-chip culture on days 3, 6, and 10, respectively, (A) presents the
data as a bar chart, while (B) presents it as a line chart. Expression of ACAN under the same conditions, (C) presents the data as a bar chart, while (D)
presents it as a line chart. The results demonstrate that the expression levels of Col II and ACAN in the cartilage-chip culture conditions were significantly
higher than those in the traditional 2D culture and 2D + microfluidic culture, indicating that cartilage chips have significant advantages in simulating the
in vivo microenvironment and promoting cartilage matrix synthesis.
Volume 1 Issue 1 (2025) 20 doi: 10.36922/or.8461