
Page 111 - AC-1-2
P. 111
Arts & Communication Music therapy and elderly people in home care
Table 2. Comparison of scores between the initial and final SEMPA assessments in the control and intervention groups
Development area Control group (n=8) Intervention group (n=10)
Initial assessment Final assessment P‑value Initial assessment Final assessment P‑value
(Average [% SD]) (average % [SD]) (Average % [SD]) (average % [SD])
Psychomotor 64.71 (35.29) 59.81 (35.78) 0.225 82.50 (20.53) 87.40 (13.58) 0.139
Perceptive-cognitive 62.79 (27.81) 61.86 (30.96) 0.208 74.60 (27.36) 80.42 (21.35) 0.114
Communication-language 59.85 (27.95) 62.47 (30.32) 0.042* 76.46 (25.02) 81.20 (22.88) 0.044*
Social-emotional 62.11 (24.01) 61.83 (30.41) 0.362 71.76 (25.23) 82.20 (18.43) 0.011*
Total 62.53 (27.95) 61.44 (31.27) 0.017* 76.32 (24.14) 82.50 (18.70) 0.037*
Notes: N: Number of research subjects; SD: Standard deviation; *P≤0.05.
A B C
D E F
G H
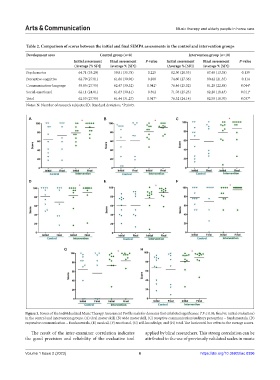
Figure 1. Scores of the Individualized Music Therapy Assessment Profile scale for domains that exhibited significance (*P ≤ 0.05, final vs. initial evaluation)
in the control and intervention groups. (A) Oral motor skill, (B) wide motor skill, (C) receptive communication/auditory perception – fundamentals, (D)
expressive communication – fundamentals, (E) musical, (F) emotional, (G) self-knowledge, and (H) total. The horizontal bar refers to the average scores.
The result of the inter-examiner correlation indicates applied by blind researchers. This strong correlation can be
the good precision and reliability of the evaluative tool attributed to the use of previously validated scales in music
Volume 1 Issue 2 (2023) 6 https://doi.org/10.36922/ac.0396