
Page 98 - AC-2-3
P. 98
Arts & Communication Digital natives’ color views in new age media
4.3. Blue color 4.4. Yellow color
For the blue color, the concepts derived from Stage 3 were The yellow color concepts used in the research were
purity, discipline, trust, seriousness, stability, balance, dynamism, hope, energy, spring, happiness, light, creativity,
harmony, freshness, and start, whereas the concepts and joy, while the concepts mentioned in the textbook
24
mentioned in textbook were trust, faith, wisdom, were joy, spring, and light.
24
reliability, truth, and stability. Only trust and stability are In both females’ and males’ responses, the concepts
common between the two lists. of light and energy had the highest number of responses
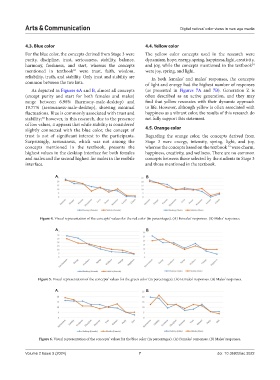
As depicted in Figures 6A and B, almost all concepts (as presented in Figures 7A and 7B). Generation Z is
(except purity and start for both females and males) often described as an active generation, and they may
range between 6.98% (harmony-male-desktop) and find that yellow resonates with their dynamic approach
19.77% (seriousness-male-desktop), showing minimal to life. However, although yellow is often associated with
fluctuations. Blue is commonly associated with trust and happiness as a vibrant color, the results of this research do
stability; however, in this research, due to the presence not fully support this statement.
30
of low values, it appears that while stability is considered
slightly connected with the blue color, the concept of 4.5. Orange color
trust is not of significant interest to the participants. Regarding the orange color, the concepts derived from
Surprisingly, seriousness, which was not among the Stage 3 were energy, intensity, spring, light, and joy,
concepts mentioned in the textbook, presents the whereas the concepts based on the textbook were charm,
24
highest values in the desktop interface for both females happiness, creativity, and wellness. There are no common
and males and the second highest for males in the mobile concepts between those selected by the students in Stage 3
interface. and those mentioned in the textbook.
A B
Figure 4. Visual representation of the concepts’ values for the red color (in percentages). (A) Females’ responses. (B) Males’ responses.
A B
Figure 5. Visual representation of the concepts’ values for the green color (in percentages). (A) Females’ responses. (B) Males’ responses.
A B
Figure 6. Visual representation of the concepts’ values for the blue color (in percentages). (A) Females’ responses. (B) Males’ responses.
Volume 2 Issue 3 (2024) 7 doi: 10.36922/ac.3022