
Page 24 - AC-3-1
P. 24
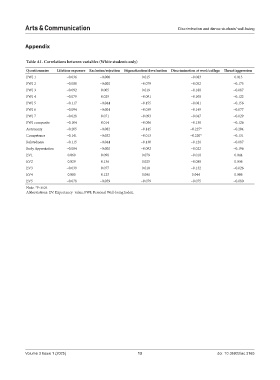
Arts & Communication                                             Discrimination and dance students’ well-being


            Appendix


            Table A1. Correlations between variables (White students only)
            Questionnaire  Lifetime exposure  Exclusion/rejection  Stigmatization/devaluation  Discrimination at work/college  Threat/aggression
            PWI 1            −0.036         −0.008           0.015                −0.083             0.013
            PWI 2            −0.080         −0.002           −0.079               −0.052            −0.175
            PWI 3            −0.092         0.005            0.019                −0.180            −0.087
            PWI 4            −0.079         0.029            −0.091               −0.100            −0.122
            PWI 5            −0.117         −0.044           −0.155               −0.081            −0.156
            PWI 6            −0.094         −0.001           −0.039               −0.149            −0.077
            PWI 7            −0.028         0.071            −0.093               −0.047            −0.029
            PWI composite    −0.104         0.014            −0.086               −0.138            −0.126
            Autonomy         −0.205         −0.082           −0.145               −0.227*           −0.204
            Competence       −0.141         −0.032           −0.013               −0.220*           −0.131
            Relatedness      −0.115         −0.044           −0.130               −0.126            −0.087
            Body Appreciation  −0.084       −0.002           −0.092               −0.022            −0.196
            EV1               0.060         0.098            0.079                −0.010             0.044
            EV2               0.029         0.136            0.025                −0.080             0.036
            EV3              −0.039         0.077            0.018                −0.132            −0.026
            EV4               0.080         0.123            0.001                 0.044             0.086
            EV5              −0.078         −0.059           −0.079               −0.075            −0.080
            Note: *P<0.05.
            Abbreviations: EV: Expectancy−value; PWI: Personal Well-being Index.


            Volume 3 Issue 1 (2025)                         13                               doi: 10.36922/ac.3165