
Page 54 - AIH-1-1
P. 54
Artificial Intelligence in Health AI model for cardiovascular disease prediction
and two output layers. The effect of the number of hidden
neurons on the network performance was carried out, and
five different numbers of hidden neurons (10, 20, 25, and
30) were investigated. In each case, the network was trained
several times and the best performance was recorded
using the Levenberg algorithm. The number of training
cycles required for proper generalization of outputs
was determined through the trial-and-error method.
Furthermore, the threshold function was determined
through trial and error (0.5). The NN was trained and
tested using 76 samples, of which 70% samples for training
and 30% samples were for testing 14, 10, and 8 attributes,
and the number of datasets varied between 2000, 1500,
1000, and 500, respectively. The data collected for training
was inputted into the training network designed. The
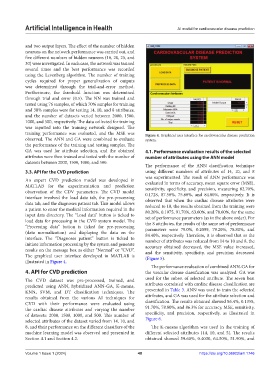
training performance was evaluated, and the MSE was Figure 4. Graphical user interface for cardiovascular disease prediction
observed. The ANN and GA were combined to evaluate system.
the performance of the training and testing samples. The
GA was used for attribute selection, and the obtained 4.1. Performance evaluation results of the selected
attributes were then trained and tested with the number of number of attributes using the ANN model
datasets between 2000, 1500, 1000, and 500.
The performance of the ANN classification technique
3.3. API for the CVD prediction using different numbers of attributes of 14, 10, and 8
was experimented. The result of ANN performance was
An expert CVD prediction model was developed in evaluated in terms of accuracy, mean square error (MSE),
MATLAB for the experimentation and prediction
observation of the CDV parameters. The CVD model sensitivity, specificity, and precision, measuring 82.70%,
0.1728, 87.50%, 75.80%, and 84.00%, respectively. It is
interface involved the load data tab, the pre-processing observed that when the cardiac disease attributes were
data tab, and the diagnoses patient tab. This model allows reduced to 10, the results obtained from the training were
a patient to enter the medical information required in the 80.20%, 0.1975, 91.70%, 63.60%, and 78.60%, for the same
input data directory. The “Load data” button is ticked to set of performance parameters (as in the above order). For
load data for processing in the CVD system model. The the 8 attributes, the results of the same set of performance
“Processing data” button is ticked for pre-processing parameters were 79.0%, 0.2099, 79.20%, 78.80%, and
(data normalization) and displaying the data on the 84.40%, respectively. Therefore, it is observed that as the
interface. The “Diagnoses patient” button is ticked to number of attributes was reduced from 14 to 10 and 8, the
initiate information processing by the system and generate accuracy obtained decreased, the MSE value increased,
results on the message box as either “Normal” or “CVD”. and the sensitivity, specificity, and precision decreased
The graphical user interface developed in MATLAB is (Figure 5).
illustrated in Figure 4.
The performance evaluation of combined ANN-GA for
4. API for CVD prediction the vascular disease classification was analyzed. GA was
The CVD dataset was pre-processed, trained, and used for the subset of selected attribute. The seven best
predicted using ANN, hybridized ANN-GA, K-means, attributes correlated with cardiac disease classification are
KNN, SVM, and DT classification techniques. The presented in Table 3. ANN was used to train the selected
results obtained from the various AI techniques for attributes, and GA was used for the attribute selection and
CVD with their performance were evaluated using classification. The results obtained showed 86.4%, 0.1358,
the cardiac disease attributes and varying the number 91.70%, 78.80%, and 86.3% for accuracy, MSE, sensitivity,
of datasets: 2000, 1500, 1000, and 500. This number of specificity, and precision, respectively, as illustrated in
selected attributes of the dataset varied from 14, 10, and Figure 6.
8, and their performance on the different classifiers of the The K-means algorithm was used in the training of
machine learning model was observed and presented in different selected attributes (14, 10, and 5). The results
Section 4.1 and Section 4.2. obtained showed 59.60%, 0.4030, 64.50%, 51.90%, and
Volume 1 Issue 1 (2024) 48 https://doi.org/10.36922/aih.1746