
Page 41 - AIH-1-3
P. 41
Artificial Intelligence in Health Predicting mortality in COVID-19 using ML
Figure 1. Data cleansing process flowchart. Image created using Draw.io (https://app.diagrams.net/)
Figure 2. Distribution plot of categorical attribute values in the valid
COVID-19 dataset. Image created using Python’s Matplotlib library.
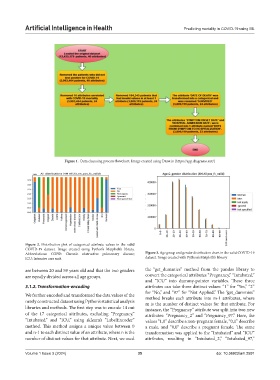
Abbreviations: COPD: Chronic obstructive pulmonary disease; Figure 3. Age group and gender distribution chart in the valid COVID-19
ICU: Intensive care unit. dataset. Image created with Python’s Matplotlib library
are between 20 and 59 years old and that the two genders the “get_dummies” method from the pandas library to
are equally divided across all age groups. convert the categorical attributes “Pregnancy,” “Intubated,”
and “ICU” into dummy-pointer variables. These three
3.1.2. Transformation-encoding attributes can take three distinct values: “1” for “Yes,” “2”
for “No,” and “97” for “Not Applied.” The “get_dummies”
We further encoded and transformed the data values of the method breaks each attribute into m-1 attributes, where
newly constructed dataset using Python’s statistical analysis m is the number of distinct values for that attribute. For
libraries and methods. The first step was to encode 14 out instance, the “Pregnancy” attribute was split into two new
of the 17 categorical attributes, excluding “Pregnancy,” attributes: “Pregnancy_2” and “Pregnancy_97.” Here, the
“Intubated,” and “ICU,” using sklearn’s “LabelEncoder” values “1,0” describe a non-pregnant female, “0,1” describe
method. This method assigns a unique value between 0 a male, and “0,0” describe a pregnant female. The same
and n-1 to each distinct value of an attribute, where n is the transformation was applied to the “Intubated” and “ICU”
number of distinct values for that attribute. Next, we used attributes, resulting in “Intubated_2,” “Intubated_97,”
Volume 1 Issue 3 (2024) 35 doi: 10.36922/aih.2591