
Page 45 - AIH-1-3
P. 45
Artificial Intelligence in Health Predicting mortality in COVID-19 using ML
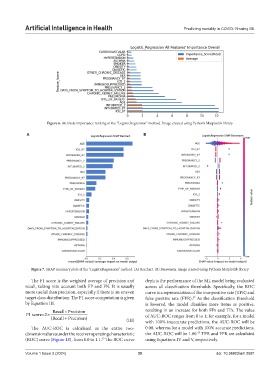
Figure 6. Attribute importance ranking of the “LogisticRegression” method. Image created using Python’s Matplotlib library
A B
Figure 7. SHAP summary plots of the “LogisticRegression” method. (A) Barchart. (B) Beeswarm. Image created using Python’s Matplotlib library
The F1 score is the weighted average of precision and depicts the performance of the ML model being evaluated
recall, taking into account both FP and FN. It is usually across all classification thresholds. Specifically, the ROC
more useful than precision, especially if there is an uneven curve is a representation of the true positive rate (TPR) and
target class distribution. The F1 score computation is given false positive rate (FPR). As the classification threshold
37
by Equation III. is lowered, the model classifies more items as positive,
Recall Precision resulting in an increase for both FPs and TPs. The value
F1 score=2 of AUC-ROC ranges from 0 to 1; for example, for a model
(RecallPrecision) (III) with 100% inaccurate predictions, the AUC-ROC will be
The AUC-ROC is calculated as the entire two- 0.00, whereas for a model with 100% accurate predictions,
dimensional area under the receiver operating characteristic the AUC-ROC will be 1.00. TPR and FPR are calculated
37
(ROC) curve (Figure 18), from 0.0 to 1.1. The ROC curve using Equations IV and V, respectively.
37
Volume 1 Issue 3 (2024) 39 doi: 10.36922/aih.2591