
Page 49 - AIH-1-3
P. 49
Artificial Intelligence in Health Predicting mortality in COVID-19 using ML
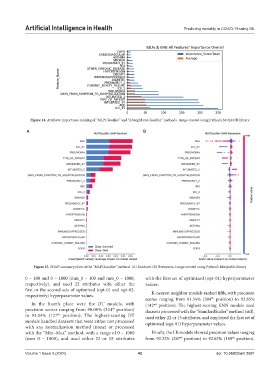
Figure 14. Attribute importance ranking of “MLPClassifier” and “KNeighborsClassifier” methods. Image created using Python’s Matplotlib library
A B
Figure 15. SHAP summary plots of the “MLPClassifier” method. (A) Barchart. (B) Beeswarm. Image created using Python’s Matplotlib library
0 – 100 and 0 – 1000 (mm_0 – 100 and mm_0 – 1000, with the first set of optimized (opt-01) hyperparameter
respectively), and used 22 attributes with either the values.
first or the second sets of optimized (opt-01 and opt-02,
respectively) hyperparameter values. K-nearest neighbor models ranked fifth, with precision
scores ranging from 91.54% (304 position) to 92.85%
th
In the fourth place were the DT models, with (142 position). The highest-scoring KNN models used
nd
precision scores ranging from 90.09% (324 position) datasets processed with the “StandardScaler” method (std),
th
to 93.04% (127 position). The highest-scoring DT used either 22 or 15 attributes, and employed the first set of
th
models handled datasets that were either not processed optimized (opt-01) hyperparameter values.
with any normalization method (none) or processed
with the “Min–Max” method, with a range of 0 – 1000 Finally, the LR models showed precision values ranging
(mm_0 – 1000), and used either 22 or 15 attributes from 92.32% (267 position) to 92.63% (169 position).
th
th
Volume 1 Issue 3 (2024) 43 doi: 10.36922/aih.2591