
Page 51 - AIH-1-3
P. 51
Artificial Intelligence in Health Predicting mortality in COVID-19 using ML
Figure 17. Creation, training, and evaluation process flowchart for each of the 324 models. Image created using Draw.io (https://app.diagrams.net/).
Abbreviation: ML: Machine learning.
4.2.3. F1 score
The XGBoost models demonstrated the highest F1
scores, ranging from 90.33% (121 position) to 91.13%
st
(1 position), with 63% (34/54) ranking above the
st
54 position. The highest-ranked XGBoost models
th
processed datasets using the “Min-Max” method, with
ranges of 0 – 10, 0 – 100, and 0 – 1000 (mm_0 – 10,
mm_0 – 100, and mm_0 – 1000, respectively), used 22
attributes, and employed the first set of optimized (opt-01)
hyperparameter values.
The RF models secured second place, with values ranging
from 88.73% (274 position) to 91.13% (2 position). The
th
nd
highest-ranked RF models handled datasets processed
with the “Min–Max” method, with ranges of 0 – 100 and 0
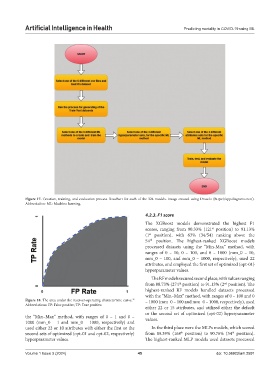
Figure 18. The area under the receiver-operating characteristic curve. – 1000 (mm_0 – 100 and mm_0 – 1000, respectively), used
37
Abbreviations: FP: False positive; TP: True positive.
either 22 or 15 attributes, and utilized either the default
or the second set of optimized (opt-02) hyperparameter
the “Min–Max” method, with ranges of 0 – 1 and 0 – values.
1000 (mm_0 – 1 and mm_0 – 1000, respectively) and
used either 22 or 10 attributes with either the first or the In the third place were the MLPs models, which scored
second sets of optimized (opt-01 and opt-02, respectively) from 89.39% (168 position) to 90.76% (34 position).
th
th
hyperparameter values. The highest-ranked MLP models used datasets processed
Volume 1 Issue 3 (2024) 45 doi: 10.36922/aih.2591