
Page 52 - AIH-1-3
P. 52
Artificial Intelligence in Health Predicting mortality in COVID-19 using ML
A
B
C
D
E
F
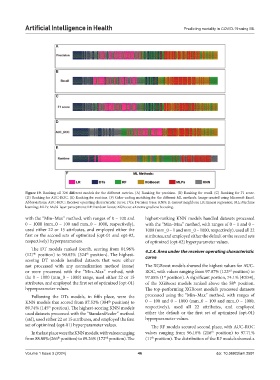
Figure 19. Ranking all 324 different models for the different metrics. (A) Ranking for precision. (B) Ranking for recall. (C) Ranking for F1 score.
(D) Ranking for AUC-ROC. (E) Ranking for runtime. (F) Color-coding matching for the different ML methods. Image created using Microsoft Excel.
Abbreviations: AUC-ROC: Receiver operating characteristic curve; DTs: Decision trees; KNN: K-nearest neighbors; LR: Linear regression; ML: Machine
learning; MLPs: Multi-layer perceptrons; RF: Random forest; XGBoost: eXtreme gradient boosting.
with the “Min–Max” method, with ranges of 0 – 100 and highest-ranking KNN models handled datasets processed
0 – 1000 (mm_0 – 100 and mm_0 – 1000, respectively), with the “Min–Max” method, with ranges of 0 – 1 and 0 –
used either 22 or 15 attributes, and employed either the 1000 (mm_0 – 1 and mm_0 – 1000, respectively), used all 22
first or the second sets of optimized (opt-01 and opt-02, attributes, and employed either the default or the second sets
respectively) hyperparameters. of optimized (opt-02) hyperparameter values.
The DT models ranked fourth, scoring from 84.96%
(127 position) to 90.03% (324 position). The highest- 4.2.4. Area under the receiver operating characteristic
th
th
curve
scoring DT models handled datasets that were either
not processed with any normalization method (none) The XGBoost models showed the highest values for AUC-
nd
or were processed with the “Min–Max” method, with ROC, with values ranging from 97.07% (122 position) to
the 0 – 1000 (mm_0 – 1000) range, used either 22 or 15 97.88% (1 position). A significant portion, 74.1% (40/54),
st
attributes, and employed the first set of optimized (opt-01) of the XGBoost models ranked above the 58 position.
th
hyperparameter values. The top-performing XGBoost model’s processed datasets
Following the DTs models, in fifth place, were the processed using the “Min–Max” method, with ranges of
KNN models that scored from 87.52% (304 position) to 0 – 100 and 0 – 1000 (mm_0 – 100 and mm_0 – 1000,
th
89.74% (145 position). The highest-scoring KNN models respectively), used all 22 attributes, and employed
th
used datasets processed with the “StandardScaler” method either the default or the first set of optimized (opt-01)
(std), used either 22 or 15 attributes, and employed the first hyperparameter values.
set of optimized (opt-01) hyperparameter values. The RF models secured second place, with AUC-ROC
th
In the last place were the KNN models, with values ranging values ranging from 96.16% (216 position) to 97.71%
from 88.88% (266 position) to 89.26% (172 position). The (11 position). The distribution of the RF models showed a
th
th
nd
Volume 1 Issue 3 (2024) 46 doi: 10.36922/aih.2591