
Page 50 - AIH-1-3
P. 50
Artificial Intelligence in Health Predicting mortality in COVID-19 using ML
A B
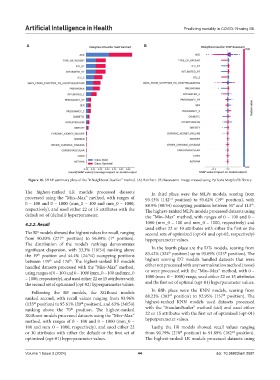
Figure 16. SHAP summary plots of the “KNeighborsClassifier” method. (A) Barchart. (B) Beeswarm. Image created using Python’s Matplotlib library
The highest-ranked LR models processed datasets In third place were the MLPs models, scoring from
processed using the “Min–Max” method, with ranges of 93.43% (142 position) to 95.62% (19 position), with
th
nd
0 – 100 and 0 – 1000 (mm_0 – 100 and mm_0 – 1000, 88.9% (48/54) occupying positions between 51 and 113 .
st
th
respectively), and used either 22 or 15 attributes with the The highest-ranked MLPs models processed datasets using
default set of (default) hyperparameter. the “Min–Max” method, with ranges of 0 – 100 and 0 –
4.2.2. Recall 1000 (mm_0 – 100 and mm_0 – 1000, respectively) and
used either 22 or 10 attributes with either the first or the
The RF models showed the highest values for recall, ranging second sets of optimized (opt-01 and opt-02, respectively)
from 90.83% (271 position) to 96.99% (1 position). hyperparameter values.
th
st
The distribution of the model’s rankings demonstrates
significant dispersion, with 33.3% (18/54) ranking above In the fourth place are the DTs models, scoring from
th
th
the 19 position and 44.4% (24/54) occupying positions 83.42% (324 position) up to 93.69% (135 position). The
th
between 119 and 176 . The highest-ranked RF models highest scoring DT models handled datasets that were
th
th
handled datasets processed with the “Min–Max” method, either not processed with any normalization method (none)
using ranges of 0 – 100 and 0 – 1000 (mm_0 – 100 and mm_0 or were processed with the “Min–Max” method, with 0 –
– 1000, respectively), and used either 22 or 15 attributes with 1000 (mm_0 – 1000) range, used either 22 or 15 attributes
the second set of optimized (opt-02) hyperparameter values. and the first set of optimal (opt-01) hyperparameter values.
Following the RF models, the XGBoost models In fifth place were the KNN models, scoring from
rd
th
ranked second, with recall values ranging from 93.96% 88.23% (303 position) to 92.95% (157 position). The
th
(133 position) to 95.61% (20 position), and 63% (34/54) highest-ranked KNN models used datasets processed
rd
ranking above the 70 position. The highest-ranked with the “StandardScaler” method (std) and used either
th
XGBoost models processed datasets using the “Min–Max” 22 or 15 attributes with the first set of optimized (opt-01)
method, with ranges of 0 – 100 and 0 – 1000 (mm_0 – hyperparameter values.
100 and mm_0 – 1000, respectively), and used either 22 Lastly, the LR models showed recall values ranging
or 10 attributes with either the default or the first set of from 90.79% (278 position) to 91.89% (182 position).
nd
th
optimized (opt-01) hyperparameter values. The highest-ranked LR models processed datasets using
Volume 1 Issue 3 (2024) 44 doi: 10.36922/aih.2591