
Page 48 - AIH-1-3
P. 48
Artificial Intelligence in Health Predicting mortality in COVID-19 using ML
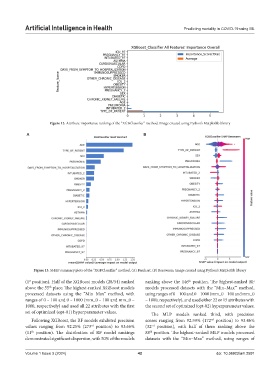
Figure 12. Attribute importance ranking of the “XGBClassifier” method. Image created using Python’s Matplotlib library
A B
Figure 13. SHAP summary plots of the “XGBClassifier” method. (A) Barchart. (B) Beeswarm. Image created using Python’s Matplotlib library
(1 position). Half of the XGBoost models (28/54) ranked ranking above the 146 position. The highest-ranked RF
st
th
above the 55 place. The highest-ranked XGBoost models models processed datasets with the “Min–Max”’ method,
th
processed datasets using the “Min–Max” method, with using ranges of 0 – 100 and 0 – 1000 (mm_0 – 100 and mm_0
ranges of 0 – 100 and 0 – 1000 (mm_0 – 100 and mm_0 – – 1000, respectively), and used either 22 or 15 attributes with
1000, respectively) and used all 22 attributes with the first the second set of optimized (opt-02) hyperparameter values.
set of optimized (opt-01) hyperparameter values. The MLP models ranked third, with precision
Following XGBoost, the RF models exhibited precision scores ranging from 92.59% (172 position) to 93.46%
nd
values ranging from 92.25% (273 position) to 93.66% (32 position), with half of them ranking above the
rd
nd
(11 position). The distribution of RF model rankings 88 position. The highest-ranked MLP models processed
th
th
demonstrated significant dispersion, with 50% of the models datasets with the “Min–Max” method, using ranges of
Volume 1 Issue 3 (2024) 42 doi: 10.36922/aih.2591