
Page 53 - AIH-1-3
P. 53
Artificial Intelligence in Health Predicting mortality in COVID-19 using ML
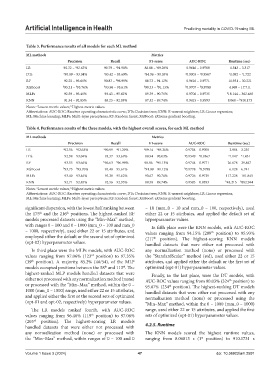
Table 3. Performance results of all models for each ML method
ML methods Metrics
Precision Recall F1-score AUC-ROC Runtime (sec)
LR 92.32 – 92.63% 90.79 – 91.98% 88.88 – 89.26% 0.9646 – 0.9708 1.343 – 3.317
a
a
a
DTs a 90.09 – 93.04% a 83.42 – 93.69% a 84.96 – 90.03% a 0.9003 – 0.9567 a 1.092 – 1.722
a
a
RF 92.25 – 93.66% 90.83 – 96.99% 88.73 – 91.12% 0.9616 – 0.9771 11.951 – 30.221
b
XGBoost b 93.21 – 93.76% b 93.96 – 95.61% b 90.33 – 91.13% b 0.9707 – 0.9788 4.969 – 17.711
b
b
b
MLPs 92.59 – 93.46% 93.43 – 95.62% 89.39 – 90.76% 0.9706 – 0.9735 b 18.144 – 362.466
b
KNN 91.54 – 92.85% 88.23 – 92.95% 87.52 – 89.74% 0.9415 – 0.9593 8.060 – 910.173
a
Notes: Lowest metric values; Highest metric values.
b
Abbreviations: AUC-ROC: Receiver operating characteristic curve; DTs: Decision trees; KNN: K-nearest neighbors; LR: Linear regression;
ML: Machine learning; MLPs: Multi-layer perceptrons; RF: Random forest; XGBoost: eXtreme gradient boosting.
Table 4. Performance results of the three models, with the highest overall scores, for each ML method
ML methods Metrics
Precision Recall F1-score AUC-ROC Runtime (sec)
a
a
LR a 92.56 – 92.63% a 90.99 – 91.29% a 89.14 – 89.26% 0.9704 – 0.9708 2.994 – 3.235
a
a
a
DTs 92.98 – 93.04% 93.37 – 93.69% 89.94 – 90.03% a 0.9549 – 0.9567 a 1.147 – 1.451
RF 93.55 – 93.66% b 96.63 – 96.99% 90.96 – 91.13% 0.9744 – 0.9771 26.678 – 29.847
b
b
XGBoost b 93.73 – 93.76% 95.40 – 95.61% b 91.09 – 91.12% b 0.9778 – 0.9788 6.128 – 6.741
b
b
MLPs 93.40 – 93.46% 95.28 – 95.62% 90.67 – 90.76% 0.9726 – 0.9729 117.228 – 181.845
b
KNN 92.71 – 92.85% 92.56 – 92.95% 89.50 – 89.74% 0.9583 – 0.9593 b 48.215 – 882.944
Notes: Lowest metric values; Highest metric values.
b
a
Abbreviations: AUC-ROC: Receiver operating characteristic curve; DTs: Decision trees; KNN: K-nearest neighbors; LR: Linear regression;
ML: Machine learning; MLPs: Multi-layer perceptrons; RF: Random forest; XGBoost: eXtreme gradient boosting.
significant dispersion, with the lowest half ranking between – 10 (mm_0 – 10 and mm_0 – 100, respectively), used
th
th
the 175 and the 216 positions. The highest-ranked RF either 22 or 15 attributes, and applied the default set of
models processed datasets using the “Min–Max” method, hyperparameter values.
with ranges 0 – 100 and 0 – 1000 (mm_0 – 100 and mm_0 In fifth place were the KNN models, with AUC-ROC
– 1000, respectively), used either 22 or 15 attributes, and values ranging from 94.15% (289 position) to 95.93%
th
employed either the default or the second set of optimized (217 position). The highest-scoring KNN models
th
(opt-02) hyperparameter values. handled datasets that were either not processed with
In third place were the MLPs models, with AUC-ROC any normalization method (none) or processed with
values ranging from 97.06% (123 position) to 97.35% the “StandardScaler” method (std), used either 22 or 15
rd
(39 position). A majority, 85.2% (46/54), of the MLP attributes, and applied either the default or the first set of
th
models occupied positions between the 58 and 113 . The optimized (opt-01) hyperparameter values.
th
th
highest-ranked MLP models handled datasets that were Finally, in the last place, were the DT models, with
either not processed with any normalization method (none) AUC-ROC values ranging from 90.03% (324 position) to
th
or processed with the “Min–Max” method, within the 0 – 95.67% (234 position). The highest-ranking DT models
th
1000 (mm_0 – 1000) range, used either 22 or 15 attributes, handled datasets that were either not processed with any
and applied either the first or the second sets of optimized normalization method (none) or processed using the
(opt-01 and opt-02, respectively) hyperparameter values. “Min–Max” method, within the 0 – 1000 (mm_0 – 1000)
The LR models ranked fourth, with AUC-ROC range, used either 22 or 15 attributes, and applied the first
values ranging from 96.46% (119 position) to 97.08% sets of optimized (opt-01) hyperparameter values.
th
(203 position). The highest-scoring LR models
rd
handled datasets that were either not processed with 4.2.5. Runtime
any normalization method (none) or processed with The KNN models scored the highest runtime values,
the “Min–Max” method, within ranges of 0 – 100 and 0 ranging from 8.06013 s (1 position) to 910.1731 s
st
Volume 1 Issue 3 (2024) 47 doi: 10.36922/aih.2591