
Page 138 - AJWEP-22-4
P. 138
Wang, et al.
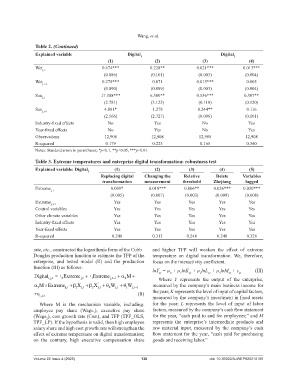
Table 2. (Continued)
Explained variable Digital 1 Digital 2
(1) (2) (3) (4)
Wet j, t 0.674*** 0.228** 0.021*** 0.013***
(0.086) (0.101) (0.003) (0.004)
Wet 0.278*** 0.071 0.015*** 0.005
j, t-1
(0.090) (0.099) (0.003) (0.004)
Sun j, t 17.308*** 6.300** 0.536*** 0.307**
(2.781) (3.125) (0.110) (0.120)
Sun j, t-1 4.881* 1.278 0.244** 0.116
(2.566) (2.727) (0.096) (0.101)
Industry-fixed effects No Yes No Yes
Year-fixed effects No Yes No Yes
Observations 12,908 12,908 12,908 12,908
R-squared 0.179 0.223 0.165 0.340
Notes: Standard errors in parentheses; *p<0.1, **p<0.05, ***p<0.01.
Table 3. Extreme temperatures and enterprise digital transformation: robustness test
Explained variable: Digital 2 (1) (2) (3) (4) (5)
Replacing digital Changing the Relative Delete Variables
transformation measurement threshold Zhejiang lagged
Extreme 0.009* 0.018*** 0.006** 0.026*** 0.030***
j, t
(0.005) (0.007) (0.003) (0.009) (0.008)
Extreme Yes Yes Yes Yes Yes
j, t-1
Control variables Yes Yes Yes Yes Yes
Other climate variables Yes Yes Yes Yes Yes
Industry-fixed effects Yes Yes Yes Yes Yes
Year-fixed effects Yes Yes Yes Yes Yes
R-squared 0.248 0.313 0.248 0.248 0.328
rate, etc., constructed the logarithmic form of the Cobb– and higher TFP will weaken the effect of extreme
Douglas production function to estimate the TFP of the temperature on digital transformation. We, therefore,
enterprise, and tested model (II) and the production focus on the interactivity coefficient.
function (III) as follows:
lnY = µ + µ lnK + µ lnL + µ lnM + ε (III)
1
3
i,t
2
i,t
i,t
i,t
i,t
0
Digital ± Extreme ±Extreme M
ij t,, 0 j t, 1 j t, 1 2 Where Y represents the output of the enterprise,
MExtreme X X W W measured by the company’s main business income for
'
3 j,tt 1 i t, 2 j t, 0 jt, 1 jt1,
(II) the year; K represents the level of input of capital factors,
,,
ij t measured by the company’s investment in fixed assets
Where M is the mechanism variable, including: for the year; L represents the level of input of labor
employee pay share (Wage ), executive pay share factors, measured by the company’s cash flow statement
1
(Wage ), cost growth rate (Cost), and TFP (TPF_OLS, for the year, “cash paid to and for employees;” and M
2
TPF_LP). If the hypothesis is valid, then high employee represents the enterprise’s intermediate products and
salary share and high cost growth rate will strengthen the raw material input, measured by the company’s cash
effect of extreme temperature on digital transformation; flow statement for the year, “cash paid for purchasing
on the contrary, high executive compensation share goods and receiving labor.”
Volume 22 Issue 4 (2025) 130 doi: 10.36922/AJWEP025210166