
Page 63 - {PDF Title}
P. 63
Carbon sequestration in a changing climate
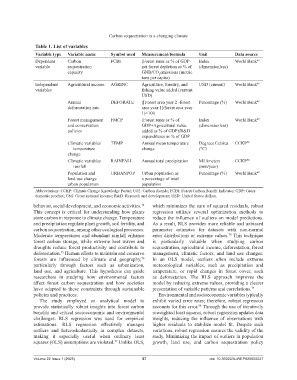
Table 1. List of variables
Variable type Variable name Symbol used Measurement/formula Unit Data source
Dependent Carbon FCBI (Forest rents as % of GDP- Index World Bank 69
variable sequestration net forest depletion as % of (dimensionless)
capacity GNI)/CO emissions (metric
2
tons per capita)
Independent Agricultural income AGRINC Agriculture, forestry, and USD (current) World Bank 69
variables fishing value added (current
USD)
Annual DEFORATE ([Forest area year 2 -forest Percentage (%) World Bank 69
deforestation rate area year 1]/forest area year
1)×100
Forest management FMCP (Forest rents as % of Index World Bank 69
and conservation GDP+Agricultural value (dimensionless)
policies added as % of GDP)/R&D
expenditures as % of GDP
Climatic variables TEMP Annual mean temperature Degrees Celsius CCKP 70
— temperature change (°C)
change
Climatic variables RAINFALL Annual total precipitation Millimeters CCKP 70
— rainfall (mm/year)
Population and URBANPOP Urban population as Percentage (%) World Bank 69
land use change — a percentage of total
urban population population
Abbreviations: CCKP: Climate Change Knowledge Portal; CO2: Carbon dioxide; FCBI: Forest Carbon Benefit Indicator; GDP: Gross
domestic product; GNI: Gross national income; R&D: Research and development; USD: United States dollars.
behavior, social development, and economic activities. which minimizes the sum of squared residuals, robust
74
This concept is critical for understanding how plants regression utilizes several optimization methods to
store carbon in response to climate change. Temperature reduce the influence of outliers on model predictions.
and precipitation regulate plant growth, soil fertility, and As a result, RLS provides more reliable and unbiased
carbon sequestration, among other ecological processes. parameter estimates for datasets with non-normal
Moderate temperatures and abundant rainfall enhance error distributions or extreme values. This technique
78
forest carbon storage, while extreme heat waves and is particularly valuable when studying carbon
droughts reduce forest productivity and contribute to sequestration, agricultural income, deforestation, forest
deforestation. Human efforts to maintain and conserve management, climatic factors, and land use changes.
75
forests are influenced by climate and geography, In an OLS model, outliers often include extreme
76
particularly through factors such as urbanization, meteorological variables, such as precipitation and
land use, and agriculture. This hypothesis can guide temperature, or rapid changes in forest cover, such
researchers in studying how environmental factors as deforestation. The RLS approach improves the
affect forest carbon sequestration and how societies model by reducing extreme values, providing a clearer
have adapted to these constraints through sustainable presentation of variable patterns and correlations. 79
policies and practices. Environmental and socioeconomic variables typically
The study employed an analytical model to exhibit varied error rates; therefore, robust regression
provide statistically robust insights into forest carbon accounts for this error. Through the use of iteratively
80
benefits and critical socioeconomic and environmental reweighted least squares, robust regression updates data
challenges. RLS regression was used for empirical weights, reducing the influence of observations with
estimations. RLS regression effectively manages higher residuals to stabilize model fit. Despite such
outliers and heteroskedasticity in complex datasets, variations, robust regression ensures the validity of the
making it especially useful when ordinary least study. Minimizing the impact of outliers in population
squares (OLS) assumptions are violated. Unlike OLS, growth, land use, and carbon sequestration policy
77
Volume 22 Issue 1 (2025) 57 doi: 10.36922/AJWEP025050027