
Page 65 - {PDF Title}
P. 65
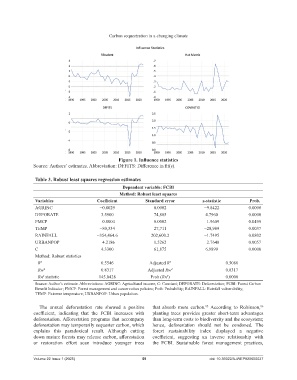
Carbon sequestration in a changing climate


                                                     Figure 1. Influence statistics
                Source: Authors’ estimates. Abbreviation: DFFITS: Difference in fit(s).


                 Table 3. Robust least squares regression estimates
                                                       Dependent variable: FCBI
                                                      Method: Robust least squares
                 Variables                  Coefficient          Standard error           z‑statistic          Prob.
                 AGRINC                      −0.0029                 0.0002                −9.8422            0.0000
                 DEFORATE                     3.5900                 74,885                4.7960             0.0000
                 FMCP                        −0.0004                 0.0002                −1.9609            0.0499
                 TEMP                        −80,334                 27,711                −28,989            0.0037
                 RAINFALL                   −354,464.6              202,600.2              −1.7495            0.0802
                 URBANPOP                    −4.2186                 1.5262                −2.7640            0.0057
                 C                            4.3300                 61,875                6.9899             0.0000
                 Method: Robust statistics
                  R 2                         0.5546               Adjusted R 2                     0.5086
                  Rw 2                        0.8317              Adjusted Rw 2                     0.8317
                  Rn  statistic              145.0428              Prob (Rn )                       0.0000
                    2
                                                                           2
                 Source: Author’s estimate. Abbreviations: AGRINC: Agricultural income; C: Constant; DEFORATE: Deforestation; FCBI: Forest Carbon
                 Benefit Indicator; FMCP: Forest management and conservation policies; Prob: Probability; RAINFALL: Rainfall vulnerability;
                 TEMP: Extreme temperature; URBANPOP: Urban population.

                  The annual deforestation  rate showed a positive   that absorb more carbon.   According to Robinson,
                                                                                                                    86
                                                                                           85
                coefficient,  indicating  that  the  FCBI  increases  with   planting  trees  provides greater  short-term  advantages
                deforestation. Afforestation  programs  that  accompany   than long-term costs to biodiversity and the ecosystem;
                deforestation may temporarily sequester carbon, which   hence, deforestation should not be condoned.  The
                explains  this  paradoxical  result.  Although  cutting   forest sustainability  index displayed a negative
                down mature forests may release carbon, afforestation   coefficient,  suggesting  an  inverse  relationship  with
                or  restoration  effort  scan  introduce  younger  trees   the FCBI. Sustainable  forest management  practices,


                Volume 22 Issue 1 (2025)                        59                           doi: 10.36922/AJWEP025050027