
Page 150 - AJWEP-v22i2
P. 150
Anser, et al.
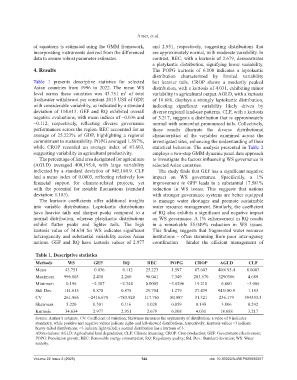
of equations is estimated using the GMM framework, and 2.951, respectively, suggesting distributions that
incorporating instruments derived from the differenced are approximately normal, with moderate variability. In
data to ensure robust parameter estimates. contrast, REC, with a kurtosis of 2.679, demonstrates
a platykurtic distribution, signifying lower variability.
4. Results The POPG kurtosis of 6.108 indicates a leptokurtic
distribution characterized by limited variability
Table 1 presents descriptive statistics for selected but heavier tails. CROP shows a modestly peaked
Asian countries from 1996 to 2022. The mean WS distribution, with a kurtosis of 4.031, exhibiting minor
level across these countries was 43.751 m of total variability in agricultural output. AGLD, with a kurtosis
3
freshwater withdrawal per constant 2015 US$ of GDP, of 18.688, displays a strongly leptokurtic distribution,
with considerable variability, as indicated by a standard indicating significant variability likely driven by
deviation of 114.613. GEF and RQ exhibited overall diverse regional land-use patterns. CLF, with a kurtosis
negative evaluations, with mean indices of −0.036 and of 3.217, suggests a distribution that is approximately
−0.112, respectively, reflecting diverse governance normal with somewhat pronounced tails. Collectively,
performances across the region. REC accounted for an these results illustrate the diverse distributional
average of 25.223% of GDP, highlighting a regional characteristics of the variables examined across the
commitment to sustainability. POPG averaged 1.597%, investigated sites, enhancing the understanding of their
while CROP recorded an average index of 87.603, statistical behavior. The analysis presented in Table 2
suggesting variability in agricultural productivity. employs a two-step GMM dynamic panel data approach
The percentage of land area designated for agriculture to investigate the factors influencing WS governance in
(AGLD) averaged 400,195.4, with large variability selected Asian countries.
indicated by a standard deviation of 945,180.9. CLF The study finds that GEF has a significant negative
had a mean index of 0.0003, reflecting relatively low impact on WS governance. Specifically, a 1%
financial support for climate-related projects, yet improvement in GEF leads to a substantial 17.581%
with the potential for notable fluctuations (standard reduction in WS issues. This suggests that nations
deviation: 1.183). with stronger governance systems are better equipped
The kurtosis coefficients offer additional insights to manage water shortages and promote sustainable
into variable distributions. Leptokurtic distributions water resource management. Similarly, the coefficient
have heavier tails and sharper peaks compared to a of RQ also exhibits a significant and negative impact
normal distribution, whereas platykurtic distributions on WS governance. A 1% enhancement in RQ results
exhibit flatter peaks and lighter tails. The high in a remarkable 55.049% reduction in WS issues.
kurtosis value of 34.634 for WS indicates significant This finding suggests that fragmented water resource
heterogeneity and substantial variability across Asian institutions – often stemming from poor inter-agency
nations. GEF and RQ have kurtosis values of 2.977 coordination – hinder the efficient management of
Table 1. Descriptive statistics
Methods WS GEF RQ REC POPG CROP AGLD CLF
Mean 43.751 −0.036 −0.112 25.223 1.597 87.603 400195.4 0.0003
Maximum 996.803 2.436 2.260 96.041 7.349 203.570 5290386 4.689
Minimum 0.196 −2.307 −2.344 0.0005 −3.6296 19.210 6.600 −3.086
Std. Dev. 114.613 0.870 0.878 29.704 1.279 27.439 945180.9 1.183
CV 261.966 −2416.670 −783.929 117.765 80.087 31.321 236.179 394333.3
Skewness 5.220 0.501 0.116 1.020 0.859 0.148 3.806 0.242
Kurtosis 34.634 2.977 2.951 2.679 6.108 4.031 18.688 3.217
Source: Author’s estimate. CV: Coefficient of variation; Skewness measures the asymmetry of distribution: a value of 0 indicates
symmetry, while positive and negative values indicate right- and left-skewed distributions, respectively; Kurtosis values >3 indicate
heavy-tailed distributions, <3 indicate light-tailed, a normal distribution has a kurtosis of 3.
Abbreviations: AGLD: Agricultural land degradation; CLF: Climate financing; CROP: Crop production; GEF: Government effectiveness;
POPG: Population growth; REC: Renewable energy consumption; RQ: Regulatory quality; Std. Dev.: Standard deviation; WS: Water
scarcity.
Volume 22 Issue 2 (2025) 144 doi: 10.36922/AJWEP025090057