
Page 151 - AJWEP-v22i2
P. 151
Asia’s water scarcity challenge
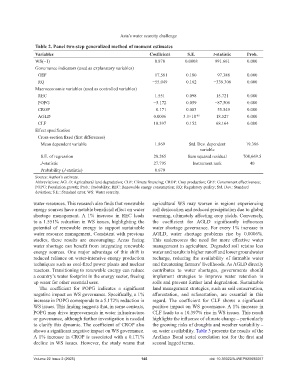
Table 2. Panel two‑step generalized method of moment estimates
Variables Coefficient S.E. t‑statistic Prob.
WS(−1) 0.878 0.0008 991.661 0.000
Governance indicators (used as explanatory variables)
GEF −17.581 0.180 −97.388 0.000
RQ −55.049 0.162 −339.306 0.000
Macroeconomic variables (used as controlled variables)
REC 1.551 0.098 15.721 0.000
POPG −5.172 0.059 −87.506 0.000
CROP −0.171 0.003 −55.549 0.000
AGLD 0.0006 3.3×10 -05 18.527 0.000
CLF 10.397 0.152 68.164 0.000
Effect specification
Cross-section fixed (first differences)
Mean dependent variable 1.869 Std. Dev. dependent 19.386
variable
S.E. of regression 28.265 Sum squared residual 708,669.5
J-statistic 27.795 Instrument rank 40
Probability (J-statistic) 0.679
Source: Author’s estimate.
Abbreviations: AGLD: Agricultural land degradation; CLF: Climate financing; CROP: Crop production; GEF: Government effectiveness;
POPG: Population growth; Prob.: Probability; REC: Renewable energy consumption; RQ: Regulatory quality; Std. Dev.: Standard
deviation; S.E.: Standard error; WS: Water scarcity.
water resources. This research also finds that renewable agricultural WS may worsen in regions experiencing
energy sources have a notable beneficial effect on water soil desiccation and reduced precipitation due to global
shortage management. A 1% increase in REC leads warming, ultimately affecting crop yields. Conversely,
to a 1.551% reduction in WS issues, highlighting the the coefficient for AGLD significantly influences
potential of renewable energy to support sustainable water shortage governance. For every 1% increase in
water resource management. Consistent with previous AGLD, water shortage problems rise by 0.0006%.
studies, these results are encouraging: Areas facing This underscores the need for more effective water
water shortage can benefit from integrating renewable management in agriculture. Degraded soil retains less
energy sources. One major advantage of this shift is water and results in higher runoff and lower groundwater
reduced reliance on water-intensive energy production recharge, reducing the availability of farmable water
techniques such as coal-fired power plants and nuclear and threatening farmers’ livelihoods. As AGLD directly
reactors. Transitioning to renewable energy can reduce contributes to water shortages, governments should
a country’s water footprint in the energy sector, freeing implement strategies to improve water retention in
up water for other essential uses. soils and prevent further land degradation. Sustainable
The coefficient for POPG indicates a significant land management strategies, such as soil conservation,
negative impact on WS governance. Specifically, a 1% afforestation, and reforestation, are essential in this
increase in POPG corresponds to a 5.172% reduction in regard. The coefficient for CLF shows a significant
WS issues. This finding suggests that, in some contexts, positive impact on WS governance. A 1% increase in
POPG may drive improvements in water infrastructure CLF leads to a 10.397% rise in WS issues. This result
or governance, although further investigation is needed highlights the influence of climate change – particularly
to clarify this dynamic. The coefficient of CROP also the growing risks of droughts and weather variability –
shows a significant negative impact on WS governance. on water availability. Table 3 presents the results of the
A 1% increase in CROP is associated with a 0.171% Arellano–Bond serial correlation test for the first and
decline in WS issues. However, the study warns that second lagged terms.
Volume 22 Issue 2 (2025) 145 doi: 10.36922/AJWEP025090057