
Page 170 - AJWEP-v22i2
P. 170
Reddy and Kumar
Figure 17 compares the control effort over time for and higher peaks, indicating increased control effort
systems with and without the ACO method. The blue and instability. The red dashed line (with ACO)
solid line (without ACO) shows larger fluctuations demonstrates reduced oscillations and smoother control
effort, suggesting improved efficiency and stability.
These results highlight the effectiveness of the ACO
method in minimizing control effort while maintaining
system performance.
Figure 18 compares the ∆δ over time for two cases:
without the ACO method (blue solid line) and with
the ACO method (red dashed line). Without ACO, the
rotor angle exhibits higher oscillations and a longer
time to stabilize. In contrast, with ACO, oscillations
are damped more rapidly, leading to a more stable and
controlled response. These results confirm the improved
performance of the ACO-based method in minimizing
∆δ and achieving superior system stability.
Figure 13. Comparison of systems with and without Figure 19 highlights improvements in dynamic
FACTS controllers stability through the optimal synchronization of
Abbreviation: FACTS: Flexible Alternating Current four FACTS controllers – SVC, STATCOM, SSSC,
Transmission System. and UPFC – optimized using the ACO method. The
performance is assessed by comparing damping
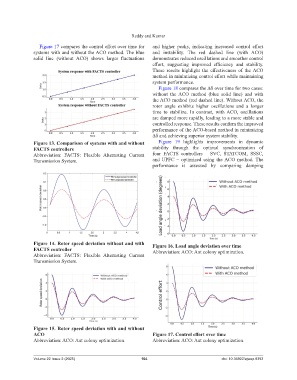
Figure 14. Rotor speed deviation without and with Figure 16. Load angle deviation over time
FACTS controller Abbreviation: ACO: Ant colony optimization.
Abbreviation: FACTS: Flexible Alternating Current
Transmission System.
Figure 15. Rotor speed deviation with and without
ACO Figure 17. Control effort over time
Abbreviation: ACO: Ant colony optimization. Abbreviation: ACO: Ant colony optimization.
Volume 22 Issue 2 (2025) 164 doi: 10.36922/ajwep.8393