
Page 169 - AJWEP-v22i2
P. 169
Enhanced renewable integration for power system stability
5.2.4. Calculation of Performance Indices FACTS controllers have effectively reduced system
To enhance system design or model a flexible system, variations in rotor speed or frequency caused by the
the current focus was on emphasizing the robustness of introduction of voltage power disturbances.
the developed controllers. In this regard, three additional Table 5 illustrates the overall active and reactive
performance indices – integral of time absolute error power loss with and without FACTS controllers for the
(ITAE), integral of square error (ISE), and integral of ACO-based systems. The proposed approach achieved
absolute error (IAE) – are also considered to analyze less power loss. Figure 13 compares the scenarios with
the performance consistency of the tuned controller, and without FACTS controllers, showing that FACTS
in addition to the confined objective function. The controllers yield the best outcomes and the most
following three performance indices can be listed in the effective system responses.
following order: Rotor speed variation can significantly affect damping
oscillations, as shown in Figure 14 when comparing rotor
t sim
ISE= (fi ) (P tieij ) dt (X) ∆ω with and without FACTS controllers. Rotor speed
2
2
0 was effectively managed by the FACTS controllers,
which also reduced deviations.
t sim
IAE= fi P tieij dt (XI) Figure 14 illustrates the effectiveness of the
0 proposed method. When a disturbance occurred, the
system experienced sudden fluctuations in load and
generator output. To prevent instability caused by these
t sim
ITAE= fi P tieij tdt (XII) oscillations, the proposed system combined an effective
0 ACO algorithm with FACTS controllers before
regulating the rotor speed.
With the proposed system, the ISE, IAE, and ITAE Figure 15 compares ∆ω for systems with and without
values were around 0.0003, 0.0353, and 0.6786. Over the proposed ACO-based controller, showing improved
time, the oscillations became less apparent, especially in system stability. The blue solid line (without ACO)
conditions with longer delays, which was why FACTS displays larger oscillations and a longer settling time. In
controllers were created. Rotor speed variations in the contrast, the red dashed line (with ACO) demonstrates
instance of d=180 ms practically came to an end at time faster damping and a reduced peak deviation. These
t=3.5 ms. However, it can be shown that the fluctuations findings indicate that the proposed controller effectively
persisted throughout the experiment for d=0 ms. This enhances system stability by minimizing oscillations
was achieved by designing the ACO-based FACTS and improving response time.
controllers for the delay scenarios. The ACO-based
Figure 16 illustrates a plot of load angle deviation
over time, comparing system behavior with and
without the ACO method. The blue solid line (without
ACO) shows larger oscillations and slower damping,
indicating instability. In contrast, the red dashed line
(with ACO) demonstrates smaller oscillations and
faster convergence to stability. These findings confirm
the effectiveness of the ACO method in enhancing
system stability and improving dynamic performance.
Table 5. Total losses for IEEE-30 bus system
Power type Without With FACTS
FACTS FACTS with
controllers controllers ACO
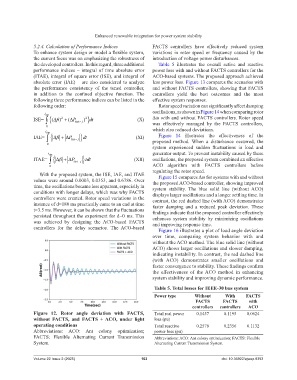
Figure 12. Rotor angle deviation with FACTS, Total real power 0.1457 0.1195 0.0624
without FACTS, and FACTS + ACO, under light loss (pu)
operating conditions Total reactive 0.2578 0.2356 0.1132
Abbreviations: ACO: Ant colony optimization; power loss (pu)
FACTS: Flexible Alternating Current Transmission Abbreviations: ACO: Ant colony optimization; FACTS: Flexible
System. Alternating Current Transmission System.
Volume 22 Issue 2 (2025) 163 doi: 10.36922/ajwep.8393