
Page 75 - AJWEP-v22i3
P. 75
Solid waste management in north coastal Andhra
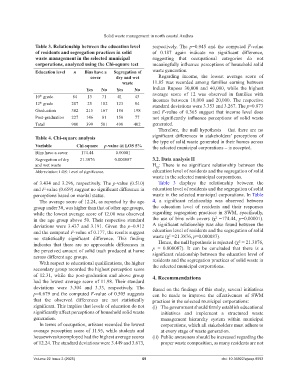
Table 3. Relationship between the education level respectively. The p=0.945 and the computed F-value
of residents and segregation practices in solid of 0.187 again indicate no significant difference,
waste management in the selected municipal suggesting that occupational categories do not
corporations, analyzed using the Chi‑square test meaningfully influence perceptions of household solid
Education level n Bins have a Segregation of waste generation.
cover dry and wet Regarding income, the lowest average score of
waste 11.85 was recorded among families earning between
Yes No Yes No Indian Rupees 30,000 and 40,000, while the highest
10 grade 84 13 71 41 43 average score of 12 was observed in families with
th
12 grade 207 25 182 123 84 incomes between 10,000 and 20,000. The respective
th
standard deviations were 3.353 and 3.267. The p=0.873
Graduation 382 215 167 184 198 and F-value of 0.365 suggest that income level does
Post-graduation 227 146 81 150 77 not significantly influence perceptions of solid waste
Total 900 399 501 498 402 generated.
Therefore, the null hypothesis – that there are no
Table 4. Chi‑square analysis significant differences in stakeholders’ perceptions of
the type of solid waste generated in their homes across
Variable Chi‑square p‑value @ LOS 5% the selected municipal corporations – is accepted.
Bins have a cover 174.44 0.00001
Segregation of dry 21.3876 0.000087 3.2. Data analysis II
and wet waste H : There is no significant relationship between the
02
Abbreviation: LOS: Level of significance. education level of residents and the segregation of solid
waste in the selected municipal corporations.
of 3.434 and 3.296, respectively. The p-value (0.510) Table 3 displays the relationship between the
and F-value (0.659) suggest no significant difference in education level of residents and the segregation of solid
perceptions based on marital status. waste in the selected municipal corporations. In Table
The average score of 12.24, as reported by the age 4, a significant relationship was observed between
group under 30, was higher than that of other age groups, the education level of residents and their responses
while the lowest average score of 12.00 was observed regarding segregation practices in SWM, specifically,
2
in the age group above 50. Their respective standard the use of bins with covers (χ =174.44, p=0.00001).
deviations were 3.437 and 3.191. Given the p=0.912 A significant relationship was also found between the
and the computed F-value of 0.177, the results suggest education level of residents and the segregation of solid
2
no statistically significant difference. This finding waste (χ =21.3876, p=0.000087). 2
indicates that there are no appreciable differences in Hence, the null hypothesis is rejected (χ = 21.3876,
the perceived amount of solid trash produced at home p = 0.000087). It can be concluded that there is a
across different age groups. significant relationship between the education level of
With respect to educational qualifications, the higher residents and the segregation practices of solid waste in
secondary group recorded the highest perception score the selected municipal corporations.
of 12.31, while the post-graduation and above group 4. Recommendations
had the lowest average score of 11.98. Their standard
deviations were 3.304 and 3.33, respectively. The Based on the findings of this study, several initiatives
p=0.679 and the computed F-value of 0.505 suggests can be made to improve the effectiveness of SWM
that the observed differences are not statistically practices in the selected municipal corporations:
significant. This implies that levels of education do not (i) The government should firmly establish educational
significantly affect perceptions of household solid waste initiatives and implement a structured waste
generation. management hierarchy system within municipal
In terms of occupation, artisans recorded the lowest corporations, which all stakeholders must adhere to
average perception score of 11.95, while students and at every stage of waste generation.
housewives/unemployed had the highest average scores (ii) Public awareness should be increased regarding the
of 12.24. The standard deviations were 3.449 and 3.673, proper waste composition, as many residents are not
Volume 22 Issue 3 (2025) 69 doi: 10.36922/ajwep.8593