
Page 74 - AJWEP-v22i3
P. 74
Saibabu, et al.
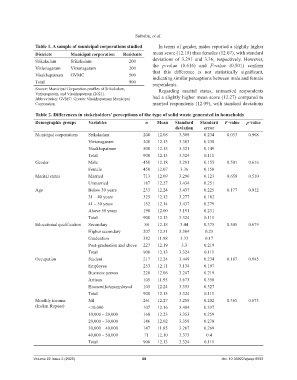
Table 1. A sample of municipal corporations studied In terms of gender, males reported a slightly higher
Districts Municipal corporation Residents mean score (12.18) than females (12.07), with standard
Srikakulam Srikakulam 200 deviations of 3.291 and 3.36, respectively. However,
Vizianagaram Vizianagaram 200 the p-value (0.616) and F-value (0.501) confirm
Visakhapatnam GVMC 500 that this difference is not statistically significant,
indicating similar perceptions between male and female
Total 900 respondents.
Source: Municipal Corporation profiles of Srikakulam, Regarding marital status, unmarried respondents
Vizianagaram, and Visakhapatnam (2021).
Abbreviation: GVMC: Greater Visakhapatnam Municipal had a slightly higher mean score (12.27) compared to
Corporation. married respondents (12.09), with standard deviations
Table 2. Differences in stakeholders’ perceptions of the type of solid waste generated in households
Demographic groups Variables n Mean Standard Standard F‑value p‑value
deviation error
Municipal corporations Srikakulam 200 12.08 3.308 0.234 0.033 0.968
Vizianagaram 200 12.13 3.363 0.238
Visakhapatnam 500 12.15 3.321 0.149
Total 900 12.13 3.324 0.111
Gender Male 450 12.18 3.291 0.155 0.501 0.616
Female 450 12.07 3.36 0.158
Marital status Married 713 12.09 3.296 0.123 0.659 0.510
Unmarried 187 12.27 3.434 0.251
Age Below 30 years 233 12.24 3.437 0.225 0.177 0.912
31 – 40 years 325 12.12 3.277 0.182
41 – 50 years 152 12.14 3.437 0.279
Above 50 years 190 12.00 3.191 0.231
Total 900 12.13 3.324 0.111
Educational qualification Secondary 84 12.18 3.44 0.375 0.505 0.679
Higher secondary 207 12.31 3.304 0.23
Graduation 382 11.98 3.33 0.17
Post-graduation and above 227 12.19 3.3 0.219
Total 900 12.13 3.324 0.111
Occupation Student 217 12.24 3.449 0.234 0.187 0.945
Employee 253 12.11 3.134 0.197
Business person 220 12.06 3.247 0.219
Artisan 105 11.95 3.673 0.358
Housewife/unemployed 105 12.24 3.353 0.327
Total 900 12.13 3.324 0.111
Monthly income Nil 261 12.27 3.258 0.202 0.365 0.873
(Indian Rupees) <10,000 107 12.16 3.484 0.337
10,000 – 20,000 168 12.23 3.353 0.259
20,000 – 30,000 146 12.02 3.358 0.278
30,000 – 40,000 147 11.85 3.267 0.269
40,000 – 50,000 71 12.10 3.373 0.4
Total 900 12.13 3.324 0.111
Volume 22 Issue 3 (2025) 68 doi: 10.36922/ajwep.8593