
Page 23 - AN-2-1
P. 23
Advanced Neurology Outcomes of implant usage for depressed skull fractures
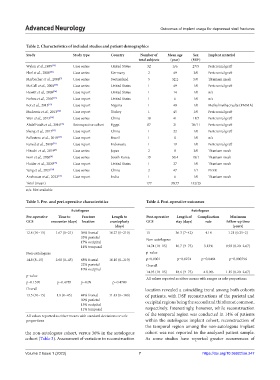
Table 2. Characteristics of included studies and patient demographics
Study Study type Country Number of Mean age Sex Implant material
total subjects (year) (M/F)
Wylen et al.,1999 [29] Case series United States 32 n/a 27/5 Pericranial graft
Ebel et al., 2000 [20] Case series Germany 2 49 2/0 Pericranial graft
Marbacher et al., 2008 [7] Case series Switzerland 5 32.2 5/0 Titanium mesh
McCall et al., 2008 [25] Case series United States 1 49 1/0 Pericranial graft
Hewitt et al., 2009 [24] Case report United States 1 14 1/0 n/a
Forbes et al., 2010 [22] Case report United States 1 6 1/0 n/a
Bot et al., 2013 [19] Case report Nigeria 1 40 1/0 Methylmethacryalte (PMMA)
Muderris et al., 2013 [26] Case report Turkey 1 45 1/0 Pericranial graft
Wan et al., 2013 [28] Case series China 18 41 11/7 Pericranial graft
AbdelFatah et al., 2016 [16] Retrospective cohort Egypt 87 21 76/11 Pericranial graft
Sheng et al., 2017 [27] Case report China 1 22 1/0 Pericranial graft
Ballestero et al., 2019 [18] Case report Brazil 1 0 1/0 n/a
Faried et al., 2019 [21] Case report Indonesia 1 19 1/0 Pericranial graft
Hitoshi et al., 2019 [9] Case series Japan 2 8 2/0 Titanium mesh
Eom et al., 2020 [8] Case series South Korea 19 50.4 18/1 Titanium mesh
Haider et al., 2020 [23] Case report United States 1 27 1/0 Titanium mesh
Yang et al., 2021 [30] Case series China 2 47 1/1 PEEK
Anehosur et al., 2022 [17] Case report India 1 6 1/0 Titanium mesh
Total (mean) 177 30.77 152/25
n/a: Not available
Table 3. Pre‑ and peri‑operative characteristics Table 4. Post‑operative outcomes
Autologous Autologous
Pre‑operative Time to Fracture Length to Post‑operative Length of Complication Minimum
GCS encounter (days) location cranioplasty GCS stay (days) rate follow‑up time
(days) (years)
12.8 (10–15) 1.67 (0–21) 36% frontal 10.27 (0–210) 15 36.3 (7–42) 4.14 1.21 (0.25–2)
33% parietal Non-autologous
17% occipital
14% temporal 14.74 (10–15) 16.7 (3–75) 3.13% 0.93 (0.20–2.67)
Non-autologous p-value
14.8 (8–15) 2.68 (0–45) 68% frontal 16.10 (0–210) p<0.0001 p=0.0274 p=0.8484 p=0.000796
22% parietal Overall
10% occipital
14.95 (10–15) 18.6 (3–75) 4 0.0% 1.15 (0.20–2.67)
p-value
All values reported as either means with ranges or sole proportions
p=0.1570 p=0.4785 p=0.09 p=0.4780
Overall location revealed a coinciding trend among both cohorts
13.5 (10–15) 1.9 (0–45) 44% frontal 11.43 (0–180) of patients, with DSF reconstructions of the parietal and
30% parietal occipital regions being the second and third most common,
15% occipital
11% temporal respectively. Interestingly, however, while reconstruction
All values reported as either means with standard deviations or sole of the temporal region was conducted in 14% of patients
proportions within the autologous implant cohort, reconstruction of
the temporal region among the non-autologous implant
the non-autologous cohort, versus 36% in the autologous cohort was not reported in the analyzed patient sample.
cohort (Table 3). Assessment of variation in reconstruction As some studies have reported greater occurrences of
Volume 2 Issue 1 (2023) 7 https://doi.org/10.36922/an.247