
Page 111 - AN-2-2
P. 111
Advanced Neurology Task oriented walking in stroke
3. Results focuses on weight-bearing and walking speed. However,
modifications in direction, speed, and slope while walking
The maximum age of the selected patients is 55 years, and require adaptation. Task-oriented walking has good effects
the minimum age is 24 years. Out of the 30 patients, 18 are on balance training because it improves sensorimotor
male and 12 are female. Ninety percentages of the patients skills and proprioception. In the task-oriented approach,
had ischemic stroke and 10% patients had hemorrhagic movement is regarded as an interaction between many
stroke. Nineteen patients have right hemiplegia while the systems in the brain and is organized around a goal and
rest have left hemiplegia. The baseline mean scores were constrained by the environment . Treadmill training,
[37]
27.2 ± 7.13 and 31.26 ± 10.43 on ABC scale and BBS, walking, and training on the ground, and tasks for
respectively, in control group, whereas the scores were 29.13 improving balance are included in task-oriented approach.
± 8.00 and 21.80 ± 8.98 in experimental group. The post- Guerra et al. (2017) conducted a systematic review on post-
interventional mean scores were 31.40 ± 6.56 and 33.46 ± stroke patients to determine the effects of circuit training
9.818 on ABC scale and BBS, respectively, in control group, on walking and gait and concluded that task-oriented
whereas the scores were 38.34 ± 8.42 and 37.06 ± 10.13 in circuit class training improved gait and gait-related aspects
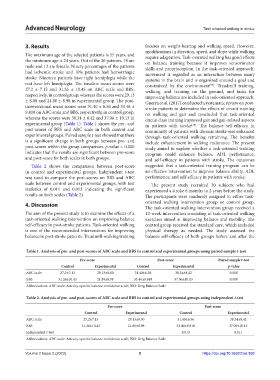
experimental group (Table 1). Table 1 shows the pre- and in patients with stroke . The balance self-efficacy in
[38]
post-scores of BBS and ABC scale in both control and community of patients with chronic stroke was enhanced
experimental groups. Paired sample t-test showed that there through task-oriented walking retraining. The benefits
is a significant change in both groups between pre- and include enhancement in walking endurance. The present
post-scores within the group comparison. p-value = 0.000 study aimed to explore whether a task-oriented training
indicates that the results are significant between pre-score program could enhance balance, ADL performance,
and post-score for both scales in both groups. and self-efficacy in patients with stroke. The outcomes
Table 2 shows the comparison between post-score suggested that a task-oriented training program can be
in control and experimental groups. Independent t-test an effective intervention to improve balance ability, ADL
was used to compare the post-scores on BBS and ABC performance, and self-efficacy in patients with stroke.
scale between control and experimental groups, with test The present study recruited 30 subjects who had
statistics of 0.011 and 0.013 indicating the significant experienced a stroke 6 months to 2 years before the study.
results on both scales (Table 2). The participants were randomly assigned to either task-
4. Discussion oriented walking intervention group or control group.
The task-oriented walking intervention group received a
The aim of the present study is to examine the effects of a 12-week intervention consisting of task-oriented walking
task-oriented walking intervention on improving balance exercises aimed at improving balance and mobility. The
self-efficacy in post-stroke patients. Task-oriented walking control group received the standard care, which included
is one of the recommended interventions for improving physical therapy as needed. The study assessed the
balance in post-stroke patients. Treadmill-walking training balance self-efficacy of both groups before and after the
Table 1. Analysis of pre‑ and post‑scores of ABC scale and BBS in control and experimental groups using paired sample t‑test
Pre‑score Post‑score Paired sample t‑test
Control Experimental Control Experimental p‑value
ABC scale 27.2±7.13 29.13±8.00 31.40±6.56 38.34±8.42 0.000
BBS 31.26±10.43 21.80±8.98 33.46±9.818 37.06±10.13 0.000
Abbreviations: ABC scale: Activity-specific balance confidence scale; BBS: Berg Balance Scale
Table 2. Analysis of pre‑ and post‑scores of ABC scale and BBS in control and experimental groups using independent t‑test
Pre‑score Post‑score
Control Experimental Control Experimental
ABC scale 27.2±7.13 29.13±8.00 31.40±6.56 38.34±8.42
BBS 31.26±10.43 21.80±8.98 33.46±9.818 37.06±10.13
Independent t-test 0.013 0.011
Abbreviations: ABC scale: Activity-specific balance confidence scale; BBS: Berg Balance Scale
Volume 2 Issue 2 (2023) 5 https://doi.org/10.36922/an.388