
Page 11 - AN-2-4
P. 11
Advanced Neurology Neonatal encephalopathy and cerebral palsy
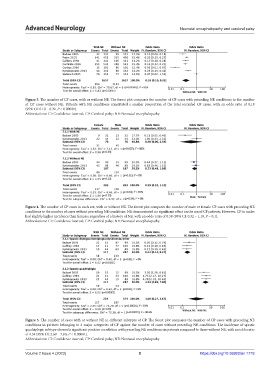
Figure 3. The number of CP cases, with or without NE. The forest plot compares the number of CP cases with preceding NE conditions to the number
of CP cases without NE. Patients with NE conditions constituted a smaller proportion of the total recorded CP cases, with an odds ratio of 0.18
(95% CI: 0.10 – 0.32, P < 0.00001).
Abbreviations: CI: Confidence interval; CP: Cerebral palsy; NE: Neonatal encephalopathy.
Figure 4. The number of CP cases in each sex, with or without NE. The forest plot compares the number of male or female CP cases with preceding NE
conditions to the number of cases without preceding NE conditions. NE demonstrated no significant effect on the sex of CP patients. However, CP in males
had slightly higher incidence than females, regardless of a history of NE, with an odds ratio of 0.59 (95% CI: 0.32 – 1.10, P = 0.1).
Abbreviations: CI: Confidence interval; CP: Cerebral palsy; NE: Neonatal encephalopathy.
Figure 5. The number of cases with or without NE in different subtypes of CP. The forest plot compares the number of CP cases with preceding NE
conditions in patients belonging to 2 major categories of CP against the number of cases without preceding NE conditions. The incidence of spastic
quadriplegic subtype showed a significant positive correlation with preceding NE conditions in patients compared to those without NE, with an odds ratio
of 4.34 (95% CI: 2.69 – 7.00, P < 0.00001).
Abbreviations: CI: Confidence interval; CP: Cerebral palsy; NE: Neonatal encephalopathy.
Volume 2 Issue 4 (2023) 5 https://doi.org/10.36922/an.1719