
Page 77 - AN-2-4
P. 77
Advanced Neurology Sexual behavior and multiple sclerosis
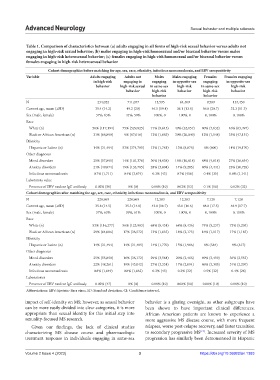
Table 1. Comparison of characteristics between (a) adults engaging in all forms of high‑risk sexual behavior versus adults not
engaging in high‑risk sexual behavior; (b) males engaging in high‑risk homosexual and/or bisexual behavior versus males
engaging in high‑risk heterosexual behavior; (c) females engaging in high‑risk homosexual and/or bisexual behavior versus
females engaging in high‑risk heterosexual behavior
Cohort demographics before matching for age, sex, race, ethnicity, infectious mononucleosis, and EBV seropositivity
Variable Adults engaging Adults not Males Males engaging Females Females engaging
in high‑risk engaging in engaging in opposite‑sex engaging in opposite‑sex
behavior high‑risk sexual in same‑sex high‑risk in same‑sex high‑risk
behavior high‑risk behavior high‑risk behavior
behavior behavior
N 234,022 711,077 13,595 64,409 9,589 137,450
Current age, mean (±SD) 35.4 (14.2) 49.2 (20) 46.5 (19.4) 36.1 (13.6) 56.8 (20.7) 32.3 (11.3)
Sex (male, female) 37%, 63% 41%, 59% 100%, 0 100%, 0 0, 100% 0, 100%
Race
White (n) 50% (117,194) 75% (529,825) 71% (9,645) 49% (32,157) 80% (7,632) 46% (63,497)
Black or African American (n) 31% (66,890) 9% (67,016) 12% (1,663) 30% (20,040) 12% (1,148) 35% (47,151)
Ethnicity
Hispanic or Latino (n) 14% (31,494) 53% (374,785) 13% (1,781) 13% (8,876) 6% (600) 14% (19,170)
Other diagnoses
Mood disorders 25% (57,895) 14% (101,370) 30% (4,038) 16% (10,818) 48% (4,618) 27% (36,654)
Anxiety disorders 21% (49,874) 19% (133,785) 28% (3,804) 14% (9,285) 46% (4,441) 23% (30,728)
Infectious mononucleosis 0.7% (1,711) 0.4% (3,074) 0.3% (43) 0.7% (456) 0.4% (35) 0.8% (1,141)
Laboratory value
Presence of EBV nuclear IgG antibody 0.02% (50) 0% (0) 0.08% (10) 0.02% (13) 0.1% (10) 0.02% (32)
Cohort demographics after matching for age, sex, race, ethnicity, infectious mononucleosis, and EBV seropositivity
N 220,969 220,969 12,383 12,383 7,128 7,128
Current age, mean (±SD) 35.8 (14.5) 35.3 (14.8) 43.0 (16.7) 43.0 (16.6) 48.8 (17.5) 48.9 (17.7)
Sex (male, female) 37%, 63% 39%, 61% 100%, 0 100%, 0 0, 100% 0, 100%
Race
White (n) 53% (116,277) 56% (123,983) 68% (8,434) 68% (8,436) 74% (5,237) 73% (5,203)
Black or African American (n) 29% (64,086) 17% (36,572) 13% (1,633) 18% (2,173) 16% (1,117) 17% (1,183)
Ethnicity
Hispanic or Latino (n) 14% (31,494) 14% (31,485) 14% (1,770) 15% (1,906) 8% (584) 9% (617)
Other diagnoses
Mood disorders 25% (55,850) 16% (36,172) 29% (3,584) 20% (2,466) 49% (3,459) 36% (2,553)
Anxiety disorders 22% (48,261) 19% (43,042) 27% (3,334) 17% (2,094) 46% (3,305) 31% (2,207)
Infectious mononucleosis 0.8% (1,649) 0.8% (1,662) 0.3% (43) 0.3% (32) 0.5% (32) 0.4% (28)
Laboratories
Presence of EBV nuclear IgG antibody 0.02% (47) 0% (0) 0.08% (10) 0.08% (10) 0.08% (10) 0.08% (10)
Abbreviations: EBV: Epstein–Barr virus, SD: Standard deviation, CI: Confidence interval.
impact of self-identity on MS; however, as sexual behavior behavior is a glaring oversight, as other subgroups have
can be more easily divided into clear categories, it is more been shown to have important clinical differences.
appropriate than sexual identity for this initial step into African American patients are known to experience a
sexuality-focused MS research. more aggressive MS disease course, with more frequent
Given our findings, the lack of clinical studies relapses, worse post-relapse recovery, and faster transition
[12]
characterizing MS disease course and pharmacologic to secondary progressive MS . Increased severity of MS
treatment response in individuals engaging in same-sex progression has similarly been demonstrated in Hispanic
Volume 2 Issue 4 (2023) 3 https://doi.org/10.36922/an.1383