
Page 35 - ARNM-2-1
P. 35
Advances in Radiotherapy
& Nuclear Medicine 99m Tc-DOX in multidrug resistance studies
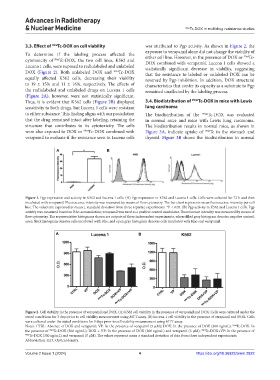
3.3. Effect of 99m Tc-DOX on cell viability was attributed to Pgp activity. As shown in Figure 2, the
exposure to verapamil alone did not change the viability of
To determine if the labeling process affected the either cell line. However, in the presence of DOX or 99m Tc-
cytotoxicity of 99m Tc-DOX, the two cell lines, K562 and DOX combined with verapamil, Lucena 1 cells showed a
Lucena 1 cells, were exposed to radiolabeled and unlabeled statistically significant decrease in viability, suggesting
DOX (Figure 2). Both unlabeled DOX and 99m Tc-DOX that the resistance to labeled or unlabeled DOX can be
equally affected K562 cells, decreasing their viability reversed by Pgp inhibition. In addition, DOX structural
to 19 ± 15% and 11 ± 16%, respectively. The effects of characteristics that confer its capacity as a substrate to Pgp
the radiolabeled and unlabeled drugs on Lucena 1 cells remained unaffected by the labeling process.
(Figure 2A), however, were not statistically significant.
Thus, it is evident that K562 cells (Figure 2B) displayed 3.4. Biodistribution of 99]m Tc-DOX in mice with Lewis
sensitivity to both drugs, but Lucena 1 cells were resistant lung carcinoma
to either substance. This finding aligns with our postulation The biodistribution of the 99]m Tc-DOX was evaluated
that the drug remained intact after labeling, retaining the in normal mice and mice with Lewis lung carcinoma.
structure that contributes to its cytotoxicity. The cells The biodistribution results in normal mice, as shown in
were also exposed to DOX or 99m Tc-DOX combined with Figure 3A, indicate uptake of 99m Tc in the stomach and
verapamil to evaluate if the resistance seen in Lucena cells thyroid. Figure 3B shows the biodistribution in normal
A B
Figure 1. Pgp expression and activity in K562 and Lucena 1 cells. (A) Pgp expression in K562 and Lucena 1 cells. Cells were cultured for 72 h and then
incubated with verapamil. Fluorescence intensity was measured by means of flow cytometry. The bar chart represents mean fluorescence intensity per cell
line. The values are expressed as mean ± standard deviation from three separate experiments. *P < 0.05. (B) Pgp activity in K562 and Lucena 1 cells. Pgp
activity was measured based on Rho accumulation; verapamil was used as a positive control modulator. Fluorescence intensity was measured by means of
flow cytometry. The representative histograms shown are outputs of three independent experiments, where filled gray histogram denotes negative control,
open black histogram denotes cells incubated with Rho, and open gray histogram denotes cells incubated with Rho and verapamil.
A B
Figure 2. Cell viability in the presence of verapamil and DOX. (A) K562 cell viability in the presence of verapamil and DOX. Cells were cultured under the
stated conditions for 3 days prior to cell viability measurement using MTT assay. (B) Lucena-1 cell viability in the presence of verapamil and DOX. Cells
were cultured under the stated conditions for 3 days prior to cell viability measurement using MTT assay.
Notes: CTRL: Absence of DOX and verapamil; VP: In the presence of verapamil (5 µM); DOX: In the presence of DOX (300 ng/mL); 99m Tc-DOX: In
the presence of 99m Tc-DOX (300 ng/mL); DOX + VP: In the presence of DOX (300 ng/mL) and verapamil (5 µM); 99m Tc-DOX+VP: In the presence of
99m Tc-DOX (300 ng/mL) and verapamil (5 µM). The values represent mean ± standard deviation of data from three independent experiments.
Abbreviation: O.D.: Optical density.
Volume 2 Issue 1 (2024) 4 https://doi.org/10.36922/arnm.2822