
Page 59 - ARNM-3-1
P. 59
Advances in Radiotherapy
& Nuclear Medicine The novel index and osteoradionecrosis
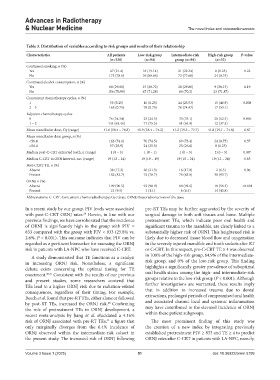
Table 3. Distribution of variables according to risk groups and results of their relationship
Characteristics All patients Low‑risk group Intermediate‑risk High‑risk group P‑value
(n=220) (n=94) group (n=94) (n=32)
Continued smoking, n (%)
Yes 47 (21.4) 18 (19.14) 21 (22.34) 8 (0.25) 0.22
No 173 (78.6) 76 (80.86) 73 (77.66) 24 (0.75)
Continued alcohol consumption, n (%)
Yes 64 (29.01) 27 (28.72) 28 (29.80) 9 (28.13) 0.19
No 156 (70.99) 67 (71.28) 66 (70.2) 23 (71.87)
Concurrent chemotherapy cycles, n (%)
1 55 (0.25) 16 (0.25) 24 (25.53) 15 (46.9) 0.008
2 – 3 165 (0.75) 78 (0.75) 70 (74.47) 17 (53.1)
Adjuvant chemotherapy cycles
0 76 (34.54) 23 (24.5) 33 (35.1) 20 (62.5) 0.006
1 – 2 144 (65.46) 71 (75.5) 61 (64.9) 12 (37.5)
Mean mandibular dose, Gy (range) 41.6 (18.4 – 74.8) 41.9 (18.4 – 74.2) 41.2 (19.3 – 73.7) 41.8 (19.1 – 74.8) 0.87
Mean mandibular dose group, n (%)
<56.4 163 (74.1) 70 (74.5) 69 (73.4) 24 (0.75) 0.57
≥56.4 57 (25.9) 24 (25.5) 25 (26.6) 8 (0.25)
Median post-C-CRT extracted teeth, n (range) 1 (0 – 5) 1 (0 – 1) 1 (0 – 5) 2 (0 – 5) 0.00*
Median C-CRT to ORN interval, mo. (range) 19 (12 – 24) 19 (19 – 19) 19 (15 – 24) 19 (12 – 24) 0.85
Post-CCRT TE, n (%)
Absent 38 (17.3) 20 (21.3) 16 (17.0) 2 (6.3) 0.06
Present 182 (82.7) 74 (78.7) 78 (83.0) 30 (93.7)
ORNJ, n (%)
Absent 199 (90.5) 93 (98.9) 88 (93.6) 18 (56.3) <0.001
Present 21 (9.5) 1 (1.1) 6 (6.4) 14 (43.8)
Abbreviations: C-CRT: Concurrent chemoradiotherapy; Gy: Gray; ORNJ: Osteoradionecrosis of the jaws.
In a recent study by our group, PIV levels were associated pre-RT TEs may be further aggravated by the severity of
with post-C-CRT ORNJ rates. Herein, in line with our surgical damage to both soft tissues and bone. Multiple
29
previous findings, we have corroborated that the incidence pretreatment TEs, which indicate poor oral health and
of ORNJ is significantly high in the group with PIV ≥ significant trauma to the mandible, are clearly linked to a
833 compared with the group with PIV < 833 (25.8% vs. substantially higher risk of ORNJ. This heightened risk is
2.6%, P < 0.001). This outcome indicates that PIV can be likely due to decreased tissue blood flow and oxygenation
regarded as a pertinent biomarker for assessing the ORNJ in the severely injured mandible and tooth sockets after RT
risk in patients with LA-NPC who have received C-CRT. or C-CRT. In this respect, pre-C-CRT TE ≥ 4 was observed
in 100% of the high-risk group, 64.9% of the intermediate-
A study demonstrated that TE functions as a catalyst
in increasing ORNJ risk. Nonetheless, a significant risk group, and 0% of the low-risk group. This finding
debate exists concerning the optimal timing for TE highlights a significantly greater prevalence of suboptimal
enactment. 40,41 Consistent with the results of our previous oral health status among the high- and intermediate-risk
and present studies, some researchers contend that groups relative to the low-risk group (P < 0.001). Although
TEs lead to a higher ORNJ risk due to radiation-related further investigations are warranted, these results imply
consequences, regardless of their timing. For example, that in addition to increased trauma due to dental
Beech et al. found that pre-RT TEs, either alone or followed extractions, prolonged periods of compromised oral health
by post-RT TEs, increased the ORNJ risk. Confirming and associated chronic local and systemic inflammation
28
the role of pretreatment TEs in ORNJ development, a may have contributed to the elevated incidence of ORNJ
recent meta-analysis by Jiang et al. elucidated a 4.16% within these patient subgroups.
risk of ORNJ associated with pre-RT TEs, a figure that The most prominent finding of this study was
42
only marginally diverges from the 6.4% incidence of the creation of a new index by integrating previously
ORNJ observed within the intermediate-risk cohort in established pretreatment PIV ≥ 833 and TE ≥ 4 to predict
the present study. The increased risk of ORNJ following ORNJ rates after C-CRT in patients with LA-NPC, namely,
Volume 3 Issue 1 (2025) 51 doi: 10.36922/arnm.5799