
Page 57 - ARNM-3-1
P. 57
Advances in Radiotherapy
& Nuclear Medicine The novel index and osteoradionecrosis
3. Results divide the patients into two groups with significantly
different rates of ORNJ. This resulted in the following
A retrospective review of the medical records of groups: PIV < 833 (n = 154) and PIV ≥ 833 (n = 66), as well
220 patients with LA-NPC treated at our institution was as TE < 4 (n = 127) and TE ≥ 4 (n = 93). When comparing
conducted. The median age was 56 (range, 18 – 76) years, the PIV and TE groups, ORNJ rates were significantly
and 151 (68.6%) patients were male. Among the patients, higher in the PIV ≥ 833 and TE ≥ 4 groups compared to
55.5% and 75.5% had a history of alcohol consumption their PIV<833 and TE<4 counterparts, respectively (2.6%
and tobacco smoking, respectively. Most patients had T3 vs. 25.8% for PIV ≥ 833; P < 0.001 and 3.14% vs. 22.4% for
– 4 (67.3%) or N2 – 3 (80%) disease stage. Before starting TE ≥ 4; P < 0.001).
C-CRT, all patients underwent at least one TE, with a
median of three TEs (range, 1 – 11), indicating poor oral As per the main objective of this study, the PIV and TE
and dental health in the study participants. The median groups were combined, resulting in four distinct groups:
time from TEs to C-CRT initiation was 16 (range, 12 – 22) Group 1, PIV < 833 and TE < 4; Group 2, PIV < 833 but
days (Table 1). The median time from C-CRT completion TE ≥ 4; Group 3, TE < 4 but PIV ≥ 833; and Group 4,
to ORNJ diagnosis was 20.8 (range, 12.4 – 27.6) months, PIV ≥ 833 and TE ≥ 4 (Figure 1). When comparing these
groups, the ORNJ rates were 1.1%, 6.6 %, 6.1%, and 43.8%
resulting in an ORNJ incidence of 9.5%. All ORNJ cases
were located in the posterior half of the affected jaw. for Groups 1 – 4, respectively. Given the indistinguishable
ORNJ rates of Groups 2 and 3 (P = 0.91), these two
Out of the 220 patients in the present study, 210 were groups were consolidated and a novel three-tiered ORNJ
also part of our previous study. We used the pre-C-CRT risk classification was formulated (Table 2: low risk
PIV cutoff of 833 and the pre-C-CRT TE cutoff of 4 to (PIV < 833 and TE < 4), intermediate risk (PIV < 833
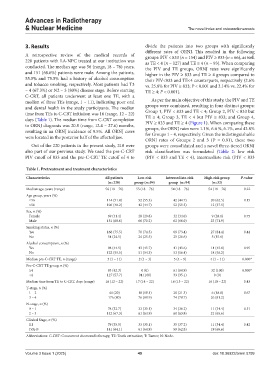
Table 1. Pretreatment and treatment characteristics
Characteristics All patients Low‑risk Intermediate‑risk High‑risk group P‑value
(n=220) group (n=94) group (n=94) (n=32)
Median age, years (range) 56 (18 – 76) 55 (18 – 76) 54 (18 – 76) 54 (18 – 76) 0.22
Age group, years (%)
≤56 114 (51.8) 52 (55.3) 42 (44.7) 20 (62.5) 0.15
>56 106 (48.2) 42 (44.7) 52 (55.3) 12 (37.5)
Sex, n (%)
Female 69 (31.4) 28 (29.8) 32 (34.0) 9 (28.1) 0.75
Male 151 (68.6) 66 (70.2) 62 (66.0) 23 (71.9)
Smoking status, n (%)
Yes 166 (75.5) 70 (74.5) 69 (73.4) 27 (84.4) 0.44
No 54 (24.5) 24 (25.5) 25 (26.6) 5 (15.6)
Alcohol consumption, n (%)
Yes 98 (44.5) 43 (45.7) 41 (43.6) 14 (43.8) 0.95
No 122 (55.5) 51 (54.3) 53 (56.4) 18 (56.2)
Median pre-C-CRT TE, n (range) 3 (1 – 11) 2 (1 – 3) 5 (4 – 9) 4 (1 – 11) 0.000*
Pre-C-CRT TE group, n (%)
≥4 93 (42.3) 0 (0) 61 (64.9) 32 (100) 0.000*
<4 127 (57.7) 94 (100) 33 (35.1) 0 (0)
Median time from TE to C-CRT, days (range) 16 (12 – 22) 17 (14 – 22) 16 (13 – 22) 16 (10 – 22) 0.43
T-stage, n (%)
1 – 2 44 (20) 18 (19.1) 20 (21.3) 6 (18.8) 0.67
3 – 4 176 (80) 76 (80.9) 74 (78.7) 26 (81.2)
N-stage, n (%)
0 – 1 78 (32.7) 33 (35.1) 34 (36.2) 11 (34.4) 0.51
2 – 3 142 (67.3) 61 (64.9) 60 (63.8) 21 (65.6)
Clinical Stage, n (%)
III 79 (35.9) 33 (35.1) 35 (37.2) 11 (34.4) 0.42
IVA-B 141 (64.1) 61 (64.9) 59 (62.8) 19 (65.6)
Abbreviations: C-CRT: Concurrent chemoradiotherapy; TE: Tooth extraction; T: Tumor; N: Node.
Volume 3 Issue 1 (2025) 49 doi: 10.36922/arnm.5799