
Page 18 - ARNM-3-2
P. 18
Advances in Radiotherapy
& Nuclear Medicine Role of PET/CT in exploring tumor heterogeneity
cancer treated with targeted therapies. They concluded and SPECT scans, providing crucial insights into a patient’s
that mixed response is a poor prognostic factor and occurs prognosis, treatment response, and tumor biology. 14,59,60
due to inter-/intratumor heterogeneity. Other studies Radiomics analysis of PET/CT images focuses on several
54
have also demonstrated heterogeneity as a reason for poor key parameters, including:
prognosis and treatment failure. 3,55,56 18 F-FDG PET/CT is (i) SUV: Reflects the metabolic activity of tumors and is
also becoming a reliable tool for evaluating the response widely used to assess tumor aggressiveness.
57
of tumors to immunotherapy. Takao et al. evaluated (ii) Total lesion glycolysis (TLG): Combines metabolic
lesion characteristics in patients with mixed response activity and tumor volume, providing a more
to immunotherapy and found a significant difference comprehensive measure of tumor burden.
between clonality and tumor-infiltrating lymphocytes (iii) Metabolically active tumor volume (MTV): Quantifies
between primary lesions and lymph node metastases. This the volume of tumor tissue with active glucose
heterogeneity leads to mixed response and progression in metabolism, which is useful for assessing tumor
lymph nodes with an overall poor prognosis. 57,58 A mixed heterogeneity and treatment response. 14,59
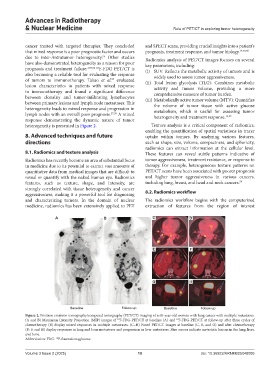
response demonstrating the dynamic nature of tumor
heterogeneity is presented in Figure 2. Texture analysis is a critical component of radiomics,
enabling the quantification of spatial variations in tracer
8. Advanced techniques and future uptake within tumors. By analyzing various features,
directions such as shape, size, volume, compactness, and sphericity,
radiomics can extract information at the cellular level.
8.1. Radiomics and texture analysis These features can reveal subtle patterns indicative of
Radiomics has recently become an area of substantial focus tumor aggressiveness, treatment resistance, or response to
in medicine due to its potential to extract vast amounts of therapy. For example, heterogeneous texture patterns on
quantitative data from medical images that are difficult to PET/CT scans have been associated with poorer prognosis
reveal or quantify with the naked human eye. Radiomics and higher tumor aggressiveness in various cancers,
features, such as texture, shape, and intensity, are including lung, breast, and head and neck cancers. 59
strongly correlated with tissue heterogeneity and cancer
aggressiveness, making it a powerful tool for diagnosing 8.2. Radiomics workflow
and characterizing tumors. In the domain of nuclear The radiomics workflow begins with the computerized
medicine, radiomics has been extensively applied to PET extraction of features from the region of interest
A B C D
E F
G H
Figure 2. Positron emission tomography/computed tomography (PET/CT) imaging of a 60-year-old woman with lung cancer with multiple metastases.
(A and B) Maximum Intensity Projection (MIP) images of F-FDG-PET/CT at baseline (A) and F-FDG-PET/CT at follow-up after three cycles of
18
18
chemotherapy (B) display mixed responses in multiple metastases. (C–H) Fused PET/CT images at baseline (C, E, and G) and after chemotherapy
(D, F, and H) display responses in lung and bone metastases and progression in liver metastases. Blue arrows indicate metastatic lesions in the lung, liver,
and bone.
Abbreviation: FDG: F-fluorodeoxyglucose.
18
Volume 3 Issue 2 (2025) 10 doi: 10.36922/ARNM025040005