
Page 64 - ARNM-3-2
P. 64
Advances in Radiotherapy
& Nuclear Medicine 18 F-FDG uptake and hypercholesterolemia
However, the precision and accuracy of quantification
methods can vary significantly.
Absolute quantification of F-FDG uptake, as used in
18
this study, is more accurate and reproducible than semi-
quantitative approaches. A major challenge with the
33
standard compartment model is its reliance on a 60-min
acquisition time, which may limit its clinical utility.
However, previous studies have demonstrated that a
30-min acquisition is adequate for accurate modeling using
a two-tissue compartment model, including for multi-bed
acquisitions. 33-37
Yet, it is not predominantly utilized in clinical practice.
Most metrics used in quantifying F-FDG uptake in
18
published studies were based on standardized uptake value
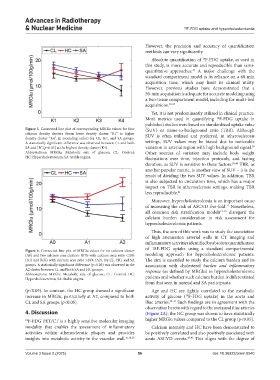
Figure 3. Connected line plot of corresponding MRGlu values for four (SUV) or tissue-to-background ratio (TBR). Although
calcium density clusters (from lower density cluster “K1” to higher SUV is often utilized and preferred, in atherosclerosis
density cluster “K4”, in ascending order) for CL, HC, and SA groups.
A statistically significant difference was observed between CL and both settings, SUV values may be biased due to noticeable
38
SA and HC (p<0.05) at the highest density cluster (K4). variation in arterial region with high background signal.
Abbreviations: MRGlu: Metabolic rate of glucose; CL: Control; Other sources of variation may include body weight
HC: Hypercholesteremia; SA: Stable angina. fluctuations over time, injection protocols, and fasting
duration, as SUV is sensitive to these factors. 39,40 TBR, as
another popular metric, is another view of SUV – it is the
result of dividing the two SUV values. In addition, TBR
is also subjected to circulation time, which has a major
impact on TBR in atherosclerosis settings, making TBR
less reproducible. 41
Moreover, hypercholesterolemia is an important cause
of increasing the risk of ASCVD five-fold. Nonetheless,
12
all common risk stratification models 13-15 disregard the
calcium burden consideration in risk assessment for
hypercholesterolemia patients.
Thus, the aim of this work was to study the association
of high attenuation arterial walls in CT imaging and
inflammatory activities identified by absolute quantification
Figure 4. Connected line plot of MRGlu values for no calcium cluster of 18F-FDG uptake using a standard compartmental
(A0) and two calcium area clusters: ROIs with calcium area ratio <20% modeling approach for hypercholesterolemic patients.
(A1) and ROIs with calcium area ratio >20% (A2), for CL, HC, and SA The aim is extended to study the calcium burden and its
groups. A statistically significant difference (p<0.05) was observed in the association with cholesterol burden and inflammatory
A2 cluster between CL and both SA and HC groups. response (as defined by MRGlu) in hypercholesterolemic
Abbreviations: MRGlu: Metabolic rate of glucose; CL: Control; HC:
Hypercholesteremia; SA: Stable angina. patients and whether such calcium burden is differentiated
from that seen in normal and SA participants.
(p<0.05). In contrast, the HC group showed a significant Age and HC are tightly correlated to the metabolic
increase in MRGlu, particularly at A2, compared to both activity of glucose ( F-FDG uptake) in the aorta and
18
CL and SA groups (p<0.05). iliac arteries. 42-44 Such findings are in agreement with the
observation herein with regard to the aorta and iliac arteries
4. Discussion (Figure 2A); the HC group was shown to have statistically
18 F-FDG PET/CT is a highly sensitive molecular imaging higher MRGlu values compared to the CL group (p<0.05).
modality that enables the assessment of inflammatory Calcium intensity and HC have been demonstrated to
activities within atherosclerotic plaques and provides be positively correlated and also positively associated with
insights into metabolic activity in the vascular wall. 16,18,21 acute ASCVD events. 45,46 This aligns with the degree of
Volume 3 Issue 2 (2025) 56 doi: 10.36922/arnm.8540