
Page 63 - ARNM-3-2
P. 63
Advances in Radiotherapy
& Nuclear Medicine 18 F-FDG uptake and hypercholesterolemia
The statistical comparison of total MRGlu values of and SAC (p<0.05). The CLC group had the lowest MRGlu
all ROIs for the CL, HC, and SA groups is illustrated in values, significantly different from the SAC group as well
Figure 2A. Both HC and SA groups had significantly (p<0.05).
higher MRGlu values compared to the CL group (p<0.05). Further, with-calcium segments in each group
However, there was no significant difference between the (CL, HC, SA) were stratified by calcium density using
HC and SA group (p>0.05).
Agatston-based clustering (K1 – K4). Figure 3 shows the
Each group (CL, HC, SA) was further subdivided based mean MRGlu values across calcium density clusters. No
on the presence or absence of arterial wall calcium (as stWWWatistical differences were found among groups for
determined by CT attenuation values above or below 130 clusters K1 – K3 (p>0.05). However, in the densest cluster
HU) into 6 subgroups: Control group, no calcium (CLN), (K4), the HC group had significantly higher MRGlu values
control group, with calcium (CLC), hypercholesterolemia, compared to the CL group (p<0.05), though differences
no calcium (HCN), hypercholesterolemia, with calcium between HC and SA groups were not significant (p<0.05).
(HCC), stable angina, no calcium (SAN) and stable angina,
with calcium (SAC). The MRGlu values of these groups, Figure 4 shows the distribution of MRGlu values for
compared using the Mann–Whitney U test, are presented no-calcium ROIs (A0), with-calcium ROIs that possess an
in Figure 2B. No significant differences were found among area ratio <20% (A1), and with-calcium ROIs that possess
the no-calcium groups (CLN, HCN, and SAN; p<0.05). an area ratio >20% (A2). In CL and SA groups, MRGlu
However, among the with-calcium groups, MRGlu values values decreased with increasing calcium area ratio, with
were significantly higher in HCC compared to both CLC significant changes observed between A0 and A1/A2
A B C
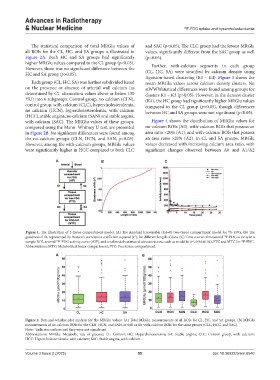
Figure 1. The illustration of 2-tissue compartment model. (A) The standard irreversible (K4=0) two-tissue compartment model for F-FDG. (B) The
18
goodness of fit, represented by Pearson’s correlation coefficient squared (r ), for different length of data. (C) Time course of measured F-FDG activity in a
18
2
sample ROI, arterial F-FDG activity curve (AIF), and total model-estimated concentrations, such as model fit (r =0.94±0.04), FTC and MTC for F-FDG.
18
18
2
Abbreviations: MTC: Metabolized tracer compartment; FTC: Free tissue compartment.
A B
Figure 2. Box-and-whisker-plot analysis for the MRGlu values. (A) Total MRGlu measurements of all ROIs for CL, HC, and SA groups. (B) MRGlu
measurements of no-calcium ROIs for the CLN, HCN, and SAN, as well as for with-calcium ROIs for the same groups (CLC, HCC, and SAC).
Note: *Indicates outliers and they were not significant.
Abbreviations: MRGlu: Metabolic rate of glucose; CL: Control; HC: Hypercholesteremia; SA: Stable angina; CLC: Control group, with calcium;
HCC: Hypercholesterolemia, with calcium; SAC: Stable angina, with calcium.
Volume 3 Issue 2 (2025) 55 doi: 10.36922/arnm.8540