


Page 68 - ARNM-3-3
P. 68
Advances in Radiotherapy
            & Nuclear Medicine                                                       Software impact in  Ho dosimetry
                                                                                                  166


                           C(A) = α × A × e –ταA                 To correct the Hermia dose map, a systematic approach

              Where C is the measured count rate, A is the activity at   was employed based on the gamma camera response curve
            the time of acquisition, α represents the detector’s linear   and its derivative, which represents the system’s sensitivity
            response coefficient, and τ denotes the detector dead time.  to activity. The underlying assumption was that the camera’s
                                                               sensitivity is directly proportional to the CF, such that:
              The fit was enforced to pass through the origin to
            determine the linear response coefficient and estimate the            CF  = k × s
                                                                                     new
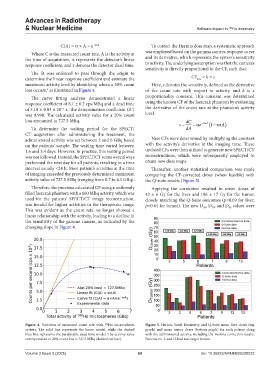
            maximum activity level by identifying where a 20% count   Here, s denotes the sensitivity, defined as the derivative
            loss occurs,  as illustrated in Figure 4.          of the  count rate with  respect to activity, and  k is  a
                     5
              The curve fitting analysis demonstrated a linear   proportionality constant. This constant was determined
            response coefficient of 8.1 ± 0.2 cps/MBq and a dead time   using the known CF of the Jaszczak phantom by evaluating
            of 3.10 ± 0.03 × 10  s. The determination coefficient (R )   the derivative of the count rate at the phantom’s activity
                           −5
                                                         2
            was 0.998. The calculated activity value for a 20% count   level.
            loss amounted to 727.5 MBq.                                         dC
                                                                             s     e  A 1  A
              To  determine  the  waiting  period  for  the  SPECT/             dA
            CT  acquisition  after administering  the treatment,  the
            administered activity was set between 2 and 6 GBq based   New CFs were determined by multiplying the constant
            on the patients’ sample. The waiting time varied between   with the activity’s derivative at the imaging time. These
            1.6 and 3.4 days. However, in practice, this waiting period   updated CFs were then utilized to generate new SPECT/CT
            was not followed. Instead, the SPECT/CT scans were always   reconstructions, which were subsequently employed to
            performed the next day for all patients, resulting in a time   create new dose maps.
            interval usually <24 h. Most patient’s activities at the time   Thereafter, another statistical comparison was made
            of imaging exceeded the previously determined maximum   comparing the  CF-corrected doses (when  feasible)  with
            activity value of 727.5 MBq (ranging from 0.7 to 4.1 GBq).  the Q-suite results (Figure 5).
              Therefore, the previous calculated CF using a uniformly   Applying  the  correction  resulted  in  mean  doses  of
            filled Jaszczak phantom with a 600 MBq activity, which was   42 ± 6 Gy for the liver and 196 ± 17 Gy for the tumor,
            used for the patients’ SPECT/CT image reconstruction,   closely matching the Q-Suite outcomes (p=0.69 for liver,
            was invalid for higher activities in the therapeutic range.   p=0.64 for tumor). The new D , D , and D  values were
            This was evident as the count rate no longer showed a                      50  70     85
            linear relationship with the activity, leading to a decline in
            the sensitivity of the gamma camera, as indicated by the
            changing slope in Figure 4.


            Figure  4. Variation of measured count rate with   166 Ho microspheres   Figure 5. Hermia Voxel Dosimetry and Q-Suite mean liver doses (top
            activity.  The  solid  line  represents  the  linear  model,  while  the  dashed   graph) and mean tumor doses (bottom  graph) for each patient along
            blue line represents the paralyzable dead time model. The activity value   with the administered activity, including the Hermia correction results.
            correspondent to 20% count loss is 727.5 MBq (dashed red line).  Patients no. 2 and 13 had two target lesions.


            Volume 3 Issue 3 (2025)                         60                        doi: 10.36922/ARNM025220023

