


Page 67 - ARNM-3-3
P. 67
Advances in Radiotherapy
            & Nuclear Medicine                                                       Software impact in  Ho dosimetry
                                                                                                  166


            outside the liver. The characteristics of the patient sample   Whole-liver and tumor absorbed doses revealed
            are detailed in Table 1.                           statistically significant discrepancies between software
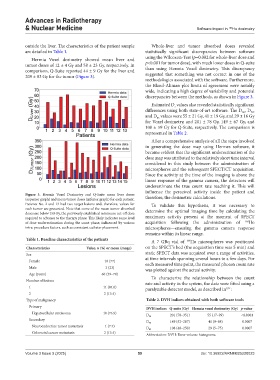
              Hermia Voxel  dosimetry showed mean  liver  and   using the Wilcoxon-Test (p=0.002 for whole-liver dose and
            tumor doses of 12 ± 4 Gy and 58 ± 23 Gy, respectively. In   p<0.001 for tumor dose), with much lower doses in Q-suite
            comparison, Q-Suite reported 44 ± 9 Gy for the liver and   than  using Hermia Voxel dosimetry.  This discrepancy
            209 ± 83 Gy for the tumor (Figure 3).              suggested that something was not correct in one of the
                                                               methodologies associated with the software. Furthermore,
                                                               the Bland-Altman plot limits of agreement were notably
                                                               wide, indicating a high degree of variability and potential
                                                               discrepancies between the methods, as shown in Figure 3.
                                                                 Estimated D  values also revealed statistically significant
                                                                           x
                                                               differences using both state-of-art software. The D , D ,
                                                                                                            70
                                                                                                        50
                                                               and D  values were 55 ± 21 Gy, 41 ± 19 Gy, and 29 ± 16 Gy
                                                                    85
                                                               for Voxel dosimetry, and 201 ± 78 Gy, 149 ± 67 Gy, and
                                                               108 ± 59 Gy for Q-Suite, respectively. The comparison is
                                                               represented in Table 2.
                                                                 After a comprehensive analysis of all the steps involved
                                                               in generating the dose map using Hermes software, it
                                                               became evident that the significant underestimation of the
                                                               dose map was attributed to the relatively short time interval
                                                               considered  in  this  study  between  the  administration  of
                                                               microspheres and the subsequent SPECT/CT acquisition.
                                                               Since the activity at the time of the imaging is above the
                                                               linear response of the gamma camera, the detectors will
                                                               underestimate the true count rate reaching it. This will
                                                               influence the perceived activity inside the patient and
            Figure  3. Hermia Voxel Dosimetry and Q-Suite mean liver doses
            (superior graph) and mean tumor doses (inferior graph) for each patient.   therefore, the dosimetric calculations.
            Patients No. 2 and 13 had two target lesions and, therefore, values for   To  validate  this  hypothesis,  it  was  necessary  to
            each tumor are presented. Note that some of the mean tumor absorbed   determine the optimal imaging time by calculating the
            doses are below 150 Gy, the previously established minimum cut-off dose
            required to advance to the therapy phase. This likely indicates some level   maximum activity present at the moment of SPECT
            of dose underestimation during the scout phase, influenced by various   acquisition following the administration of   166 Ho
            intra-procedure factors, such as consistent catheter placement.  microspheres—ensuring the gamma camera response
                                                               remains within its linear range.
            Table 1. Baseline characteristics of the patients
                                                                 A 7 GBq vial of   166 Ho microspheres was positioned
            Characteristics           Value, n (%) or mean (range)  on the SPECT’s bed (the acquisition time was 5 min) and
            Sex                                                static SPECT data was acquired over a range of activities,
             Female                          10 (77)           at time intervals spanning several hours to a few days. For
                                                               each measured time point, the measured photon count rate
             Male                             3 (23)           was plotted against the actual activity.
             Age (years)                    60 (39–74)
                                                                 To characterize  the relationship  between  the  count
            Number of lesions                                  rate and activity in the system, the data were fitted using a
             1                               11 (84.6)         paralyzable detector model, as described in :
                                                                                                 9,21
             2                               2 (15.4)
            Type of malignancy                                 Table 2. DVH indices obtained with both software tools
             Primary                                           DVH indices Q‑suite (Gy) Hermia voxel dosimetry (Gy) p‑value
               Hepatocellular carcinoma      10 (76.9)
                                                               D 50      201 (70–351)    55 (17–99)     <0.0001
             Secondary
                                                               D 70      149 (52–287)     41 (9–88)     0.0007
               Neuroendocrine tumor metastasis  1 (7.7)
                                                               D 85      108 (40–250)     29 (5–75)     0.0007
               Colorectal cancer metastasis  2 (15.4)
                                                               Abbreviation: DVH: Dose-volume histograms.

            Volume 3 Issue 3 (2025)                         59                        doi: 10.36922/ARNM025220023

