


Page 66 - ARNM-3-3
P. 66
Advances in Radiotherapy
            & Nuclear Medicine                                                       Software impact in  Ho dosimetry
                                                                                                  166


            contouring on the CT. In many patients, tumor margins   Both the tumor and liver VOIs were delineated using
            were not clearly visualized on the non-contrast-enhanced   manual contouring. The tumor VOI was delineated
            CT  acquired  along  with  the  SPECT.  Therefore,  tumor   according to contrast-enhanced CT images or, when
            segmentation, performed by nuclear medicine/radiology   feasible, the non-contrast-enhanced CT from the
            physicians, was accomplished by fusing the SPECT images   SPECT/CT.
            with a recent contrast-enhanced CT.
                                                                 The tumor and liver mean doses were calculated for
            2.2.2. Q-suite                                     each patient and then compared with Hermia results. Dose

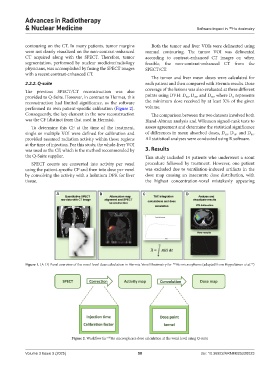
            The  previous  SPECT/CT  reconstruction  was  also   coverage of the lesions was also evaluated at three different
            provided to Q-Suite. However, in contrast to Hermes, this   points using DVH: D , D , and D , where D  represents
                                                                                    70
                                                                                           85
                                                                                                    X
                                                                                50
            reconstruction had limited significance, as the software   the minimum dose received by at least X% of the given
            performed its own patient-specific calibration (Figure 2).   volume.
            Consequently, the key element in the new reconstruction   The comparison between the two datasets involved both
            was the CF (distinct from that used in Hermia).    Bland-Altman analysis and Wilcoxon signed-rank tests to
              To determine this CF at the time of the treatment,   assess agreement and determine the statistical significance
            single or multiple VOI were defined for calibration and   of differences in mean absorbed doses, D , D , and D .
                                                                                                 50
                                                                                                    70
                                                                                                            85
            provided assumed radiation activity within those regions   All statistical analyses were conducted using R software.
            at the time of injection. For this study, the whole-liver VOI
            was used as the CF, which is the method recommended by   3. Results
            the Q-Suite supplier.                              This study included 14  patients who underwent a scout
              SPECT counts are converted into activity per voxel   procedure followed by  treatment.  However,  one patient
            using the patient-specific CF and then into dose per voxel   was excluded due to ventilation-induced artifacts in the
            by convolving the activity with a holmium DPK for liver   dose map causing an inaccurate dose distribution, with
            tissue.                                            the highest concentration-voxel mistakenly appearing


                         A                 B                  C                 D


            Figure 1. (A-D) Panel overview of the voxel-level dose calculation in Hermia Voxel Dosimetry for  Ho microspheres (adapted from Hippeläinen et al. )
                                                                          166
                                                                                                            19


                                               166
                                Figure 2. Workflow for  Ho microspheres dose calculation at the voxel level using Q-suite

            Volume 3 Issue 3 (2025)                         58                        doi: 10.36922/ARNM025220023

