
Page 10 - BH-1-2
P. 10
Brain & Heart Post-stroke atrial fibrillation and predictive scores
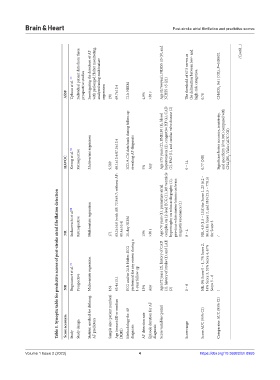
Individual patient data from three Investigating the detection of AF with prolonged Holter monitoring, analyzed using multivariate Age (0.76×year), NIHSS ≤5 (9), and The threshold of 67.5 serves as the delineation between low- and CHADS 2 0.61 (NR), P=0.00032 (Cont’d...)
Uphaus et al. [10] prospective studies 72-h NIEM NIHSS >5 (21) high-risk categories.
AS5F regression 191 69.7±13.4 4.9% >30 s 0.78
HAVOC Kwong et al. [9] Retrospective Multivariate regression 9,589 68.1±13.4/67.5±13.4 ICD-9-CM data bank during follow-up revealing AF diagnosis 5% Any Age ≥75 years (2), BMI≥30 (1), blood hypertension (2), congestive HF (4), CAD (2), PAD (1), and cardiac valve disease (2) 0 – 14 0.77 (NR) Significant better accuracy, sensitivity, and specificity (P<0.001) compared with CHA 2 DS 2 -VASc (AUC NR)
Table 1. Synoptic table for predictive scores of post‑stroke atrial fibrillation detection
Sudacevschi et al. [8] Retrospective Multivariate regression 63.2±16.0 (with AF: 72.9±9.7; without AF: 21-day NIEM Age>70 years (1), premature atrial complex on 12-lead ECG (1), left ventricle hypertrophy on echocardiography (1), previous white matter lesions on brain magnetic resonance (1) NR, 4.8 (1.5 – 13.8) for Score 1, 23 (6.2 – 86.4) for Score 2, and 110 (15.5 – 778.5)
NR 171 61.4±16.4) 15% >30 s 0 – 4 for Score 3 /
Bugnicourt et al. [7] Prospective Multivariate regression ECG and/or 24-h Holter-ECG performed for any reason during a 1-year follow-up Age≥72 years (2), history of CAD (1), history of stroke (1), and LAE NR, 0% Score 0 – 1, 7% Score 2, 14% Score 3, 32% Score 4, 67%
NR 164 65.4±15.1 13% Any (2) 0 – 6 Score 5 – 6 /
Score acronym Study Study design Statistic method for defining AF predictors Sample size (patient number) Age (mean±SD or median [IQR]) Methodology for AF diagnosis AF detection rate Episode duration for AF diagnosis Score variables (point) Score range Score AUC (95% CI) Comparator AUC (95% CI)
Volume 1 Issue 2 (2023) 4 https://doi.org/10.36922/bh.0955