
Page 126 - DP-2-3
P. 126
Design+ ML for predicting Alzheimer’s progression
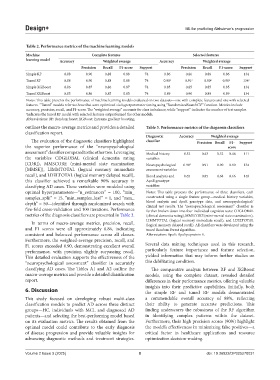
Table 2. Performance metrics of the machine learning models
Machine Complete features Selected features
learning model Accuracy Weighted average Accuracy Weighted average
Precision Recall F1‑score Support Precision Recall F1‑score Support
Simple RF 0.88 0.90 0.88 0.88 74 0.86 0.86 0.86 0.86 134
Tuned RF 0.88 0.90 0.88 0.88 74 0.90 a 0.91 a 0.90 a 0.90 a 134 a
Simple XGBoost 0.86 0.87 0.86 0.87 74 0.85 0.85 0.85 0.85 134
Tuned XGBoost 0.85 0.86 0.85 0.85 74 0.89 0.90 0.89 0.89 134
Notes: This table presents the performance of machine learning models evaluated on two datasets—one with complete features and one with selected
features. “Tuned” models refer to those that were optimized via hyperparameter tuning using “RandomizedSearchCV” function. Metrics include
accuracy, precision, recall, and F1-score. The “weighted average” accounts for class imbalance, while “support” indicates the number of test samples.
a Indicates the tuned RF model with selected features outperformed the other models.
Abbreviations: RF: Random forest; XGBoost: Extreme gradient boosting.
outlines the macro-average metrics and provides a detailed Table 3. Performance metrics of the diagnosis classifiers
classification report.
Diagnostic Accuracy Weighted average
The evaluation of the diagnostic classifiers highlighted classifier Precision Recall F1‑ Support
the superior performance of the “neuropsychological score
assessment” classifier compared to the other two. Leveraging Medical history 0.52 0.43 0.52 0.46 111
the variables CDGLOBAL (clinical dementia rating variables
[CDR]), MMSCORE (mini-mental state examination Neuropsychological 0.90 a 0.91 0.90 0.90 134
[MMSE]), LIMMTOTAL (logical memory immediate assessment variables
recall), and LDELTOTAL (logical memory delayed recall), Blood analysis and 0.65 0.85 0.68 0.66 148
this classifier achieved a remarkable 90% accuracy in ApoE genotype
classifying AD cases. These variables were modeled using variables
optimal hyperparameters—“n_estimators” = 100, “min_ Notes: This table presents the performance of three classifiers, each
samples_split” = 15, “min_samples_leaf” = 1, and “max_ constructed using a single feature group—medical history variables,
depth” = 50—identified through randomized search with blood analysis and ApoE genotype data, and neuropsychological/
clinical test results. The “neuropsychological assessment” classifier is
five-fold cross-validation and 100 iterations. Performance further broken down into four individual cognitive tests: CDGLOBAL
metrics of the diagnosis classifiers are presented in Table 3. (clinical dementia rating), MMSCORE (mini-mental state examination),
LIMMTOTAL (logical memory immediate recall), and LDELTOTAL
In terms of macro-average metrics, precision, recall, (logical memory delayed recall). All classifiers were developed using the
and F1 scores were all approximately 0.86, indicating tuned Random Forest algorithm.
consistent and balanced performance across all classes. Abbreviation: ApoE: Apolipoprotein E.
Furthermore, the weighted-average precision, recall, and
F1 scores exceeded 0.90, demonstrating excellent overall Several data mining techniques used in this research,
performance, with precision slightly surpassing recall. particularly feature importance and feature selection,
This detailed evaluation supports the effectiveness of the yielded information that may inform further studies on
“neuropsychological assessment” classifier in accurately this debilitating condition.
classifying AD cases. The Tables A1 and A2 outline the The comparative analysis between RF and XGBoost
macro-average metrics and provide a detailed classification models, using the complete dataset, revealed detailed
report. differences in their performance metrics, offering valuable
insights into their predictive capabilities. Initially, both
6. Discussion the simple RF and tuned RF models demonstrated
This study focused on developing robust multi-class a commendable overall accuracy of 88%, reflecting
classification models to predict AD across three distinct their ability to generate accurate predictions. This
groups—HC, individuals with MCI, and diagnosed AD finding underscores the robustness of the RF algorithm
patients—and selecting the best-performing model based in identifying complex patterns within the dataset.
on its evaluation metrics. The results obtained from the Furthermore, their high precision scores (90%) highlight
optimal model could contribute to the early diagnosis the model’s effectiveness in minimizing false positives—a
of disease progression and provide valuable insights for critical factor in healthcare applications and resource
advancing diagnostic methods and treatment strategies. optimization decision-making.
Volume 2 Issue 3 (2025) 8 doi: 10.36922/DP025270031