
Page 87 - EER-1-1
P. 87
Explora: Environment
and Resource Experimental application of GQDs for nuclear materials removal
3. Results and discussion with the planar configuration of sp2-bonded carbon.
The band’s position is independent of the laser excitation
3.1. Development of GQDs and characterizations frequency, distinguishing it from other graphene bands and
GQDs can be produced using top-down and bottom-up allowing the determination of graphene layer thickness.
strategies, involving methods, such as electron beam As layer thickness increases, the band’s position shifts to
lithography, hydrothermal routes, acidic exfoliation, lower energy, reflecting a slight softening of the bonds. The
and chemical oxidation. These methods vary in terms D bands are related to collective vibration modes of rings
of equipment requirements, cost, yield, and emission in the graphene network adjacent to edges or defects, while
color of GQDs. A green, environmentally friendly route the 2D band refers to second-order processes. Changes
using deionized water and glucose as pre-cursors has in the shapes, positions, and intensities of these bands
been described, capable of producing organic solvent- reflect structural changes and electronic properties. The
free GQDs suitable for biological applications. Using the intensity ratio between the D and G bands (ID/IG) is used
Stokes-Einstein equation, the DLS technique estimated to estimate structural disorder. 29,30
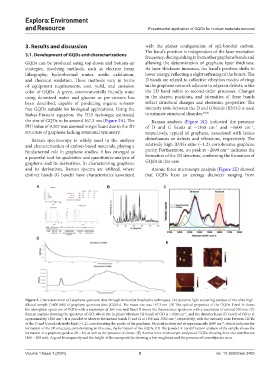
the size of GQDs to be around 167.3 nm (Figure 2A). The Raman analysis (Figure 2C) indicated the presence
PDI value of 0.507 was deemed insignificant due to the 2D of D and G bands at ~1360 cm and ~1600 cm ,
−1
−1
structure of graphene lacking rotational symmetry. respectively, typical of graphene, associated with lattice
Raman spectroscopy is widely used in the analysis disturbances or defects and vibrations, respectively. The
and characterization of carbon-based materials, playing a relatively high ID/IG ratio (~1.2) corroborates graphene
−1
fundamental role in graphene studies. It has emerged as purity. Furthermore, no peak at ~2690 cm indicates the
a powerful tool for qualitative and quantitative analysis of formation of the 2D structure, confirming the formation of
graphene and its derivatives. In characterizing graphene GQDs in this case.
and its derivatives, Raman spectra are utilized, where Atomic force microscopy analysis (Figure 2E) showed
distinct bands (G bands) have characteristics associated that GQDs have an average diameter ranging from
A B C
D
E
Figure 2. Characterization of Graphene quantum dots through molecular biophysics techniques. (A) dynamic light scattering analysis of the ultra-high-
diluted sample (1:400.000) of graphene quantum dots (GQDs). The mean size was 167.3 nm. (B) The optical properties of the GQDs. Panel A shows
the absorption spectrum of GQDs with a maximum of 265 nm, and Panel B shows the fluorescence spectrum with a maximum of around 530 nm. (C)
Raman analysis showing the spectrum of GO, where the in-phase vibration (G band) of GO is ~1600 cm , and the disorder band (D band) of GO is at
−1
approximately 1360 cm . It is possible to observe the intense bands D and G at 1356 and 1582 cm , respectively, with the intensity ratio between ID/IG
−1
−1
of the D and G peak relatively high (~1.2), corroborating the purity of the graphene. No peak is observed at approximately 2690 cm , which indicates the
−1
formation of the 2D structure, corroborating, in this case, the formation of the GQDs. (D) The powder X-ray diffraction analysis of the sample shows the
formation of a graphene peak at 2θ = 10, as well as the presence of citrate. (E) Atomic force microscopic analysis of GQDs showing their size distribution
(160 – 280 nm). A good homogeneity and the height of the nanoparticles showing a low roughness and the presence of coverslips are seen.
Volume 1 Issue 1 (2024) 5 doi: 10.36922/eer.3403