
Page 145 - EJMO-9-1
P. 145
Eurasian Journal of Medicine and
Oncology
Machine learning insights into heart failure outcomes
Table 3. Performance metrics of various machine learning
models trained on the selected attributes to predict death
events among heart failure patients
Performance Logistic Random Support Gradient
metric regression forest vector boosting
machine machine
Accuracy 0.80 0.73 0.58 0.73
Precision 0.88 0.80 0.00 0.76
Recall 0.60 0.48 0.00 0.52
F1-score 0.71 0.60 0.00 0.61
AUC-ROC 0.83 0.84 0.52 0.88
Abbreviation: AUC-ROC: Area under the curve of the receiver
operating characteristic. Figure 3. The area under the curve of the receiver operating characteristic
(AUC-ROC) plot illustrates the performance of different machine
learning models in predicting death events among heart failure patients.
performance in predicting death events among HF patients. Each curve represents the ROC curve for a specific model, with the AUC
The SVM model performed less favorably, achieving an score indicating the discriminative ability of the model to distinguish
accuracy of 58.33%, with precision and recall values of between positive and negative outcomes.
0% due to the lack of positive predictions. Consequently, Abbreviations: AOC: Area under the curve; ROC: Receiver operating
characteristic
the F1-score and AUC-ROC metrics did not apply to this
model. On the other hand, the GBM classifier exhibited an
accuracy of 73.33%, precision of 76.47%, recall of 52%, and A B
F1-score of 61.90%. The AUC-ROC value for this model
was 88.23%, indicating strong discriminative ability and
high predictive performance.
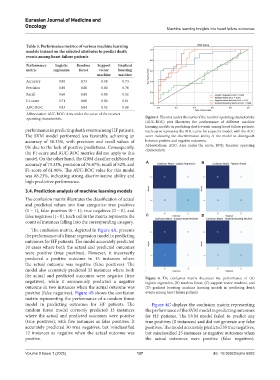
3.4. Prediction analysis of machine learning models
The confusion matrix illustrates the classification of actual
and predicted values into four categories: true positives
(1 – 1), false positives (0 – 1), true negatives (0 – 0), and
false negatives (1– 0). Each cell in the matrix represents the C D
count of instances falling into the corresponding category.
The confusion matrix, depicted in Figure 4A, presents
the performance of a linear regression model in predicting
outcomes for HF patients. The model accurately predicted
10 cases where both the actual and predicted outcomes
were positive (true positives). However, it incorrectly
predicted a positive outcome in 15 instances where
the actual outcome was negative (false positives). The
model also accurately predicted 33 instances where both
the actual and predicted outcomes were negative (true Figure 4. The confusion matrix illustrates the performance of (A)
negatives), while it erroneously predicted a negative logistic regression, (B) random forest, (C) support vector machine, and
outcome in two instances when the actual outcome was (D) gradient boosting machine learning models in predicting death
positive (false negatives). Figure 4B shows the confusion events among heart failure patients
matrix representing the performance of a random forest
model in predicting outcomes for HF patients. The Figure 4C displays the confusion matrix representing
random forest model correctly predicted 13 instances the performance of the SVM model in predicting outcomes
where the actual and predicted outcomes were positive for HF patients. The SVM model failed to predict any
(true positives), with five instances as false positives. It true positives (0 instances) and did not generate any false
accurately predicted 30 true negatives, but misclassified positives. The model accurately predicted 35 true negatives,
12 instances as negative when the actual outcome was but misclassified 25 instances as negative outcomes when
positive. the actual outcomes were positive (false negatives).
Volume 9 Issue 1 (2025) 137 doi: 10.36922/ejmo.6583