
Page 211 - EJMO-9-3
P. 211
Eurasian Journal of
Medicine and Oncology FN3K–Nrf2 axis inhibition in breast cancer
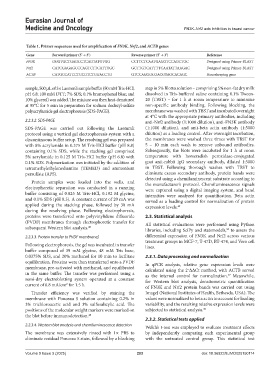
Table 1. Primer sequences used for amplification of FN3K, Nrf2, and ACTB genes
Gene Forward primer (5’ → 3’) Reverse primer (5’ → 3’) Reference
FN3K GGGTGCTGAGCCTCAGTATGTGG CCTTCTCAATGAGGTCCAGCTGC Designed using Primer-BLAST
Nrf2 CATCGAGAGCCCAGTCTTCATTTGC GCTTGTCATTTTCAATATTAAGAC Designed using Primer-BLAST
ACTB CATGCCATCCTGCGTCTGGACCTG GTCCAGGGCGACGTAGCACAGC Housekeeping gene
sample, 500 µL of 3× Laemmli sample buffer (50 mM Tris-HCl, step in 5% Blotto solution – comprising 5% non-fat dry milk
pH 6.8; 100 mM DTT; 7% SDS; 0.1% bromophenol blue; and dissolved in Tris-buffered saline containing 0.1% Tween-
10% glycerol) was added. The mixture was then heat-denatured 20 (TBST) – for 1 h at room temperature to minimize
at 95°C for 5 min in preparation for sodium dodecyl-sulfate non-specific antibody binding. Following blocking, the
polyacrylamide gel electrophoresis (SDS-PAGE). membrane was washed with TBST and incubated overnight
at 4°C with the appropriate primary antibodies, including
2.2.3.2. SDS-PAGE anti-Nrf2 antibody (1:1000 dilution), anti-FN3K antibody
SDS-PAGE was carried out following the Laemmli (1:1000 dilution), and anti-beta actin antibody (1:5000
protocol using a vertical gel electrophoresis system with a dilution) as a loading control. After overnight incubation,
discontinuous buffer setup. The resolving gel was prepared the membranes were washed three times with TBST for
with 8% acrylamide in 0.375 M Tris-HCl buffer (pH 8.8) 5 – 10 min each wash to remove unbound antibodies.
containing 0.1% SDS, while the stacking gel comprised Subsequently, the blots were incubated for 1 h at room
5% acrylamide in 0.125 M Tris-HCl buffer (pH 6.8) with temperature with horseradish peroxidase-conjugated
0.1% SDS. Polymerization was initiated by the addition of goat anti-rabbit IgG secondary antibody, diluted 1:5000
tetramethylethylenediamine (TEMED) and ammonium in TBST. Following thorough washes with TBST to
persulfate (APS). eliminate excess secondary antibody, protein bands were
detected using a chemiluminescent substrate according to
Protein samples were loaded into the wells, and the manufacturer’s protocol. Chemiluminescence signals
electrophoretic separation was conducted in a running were captured using a digital imaging system, and band
buffer consisting of 0.025 M Tris-HCl, 0.192 M glycine, intensities were analyzed for quantification. Beta actin
and 0.1% SDS (pH 8.3). A constant current of 20 mA was served as a loading control for normalization of protein
applied during the stacking phase, followed by 30 mA expression levels. 49
during the resolving phase. Following electrophoresis,
proteins were transferred onto polyvinylidene difluoride 2.3. Statistical analysis
(PVDF) membranes through electrophoretic transfer for All statistical evaluations were performed using Python
subsequent Western blot analysis. 48 libraries, including SciPy and statsmodels, to assess the
50
2.2.3.3. Protein transfer to PVDF membrane] differential expression of FN3K and Nrf2 across various
treatment groups in MCF-7, T-47D, BT-474, and Vero cell
Following electrophoresis, the gel was incubated in transfer lines.
buffer composed of 39 mM glycine, 48 mM Tris base,
0.0375% SDS, and 20% methanol for 10 min to facilitate 2.3.1. Data processing and normalization
equilibration. Proteins were then transferred onto a PVDF In qPCR analysis, relative gene expression levels were
membrane, pre-activated with methanol, and equilibrated calculated using the 2⁻ΔΔCt method, with ACTB served
in the same buffer. The transfer was performed using a as the internal control for normalization. Meanwhile,
47
semi-dry electroblotting system operated at a constant for Western blot analysis, densitometric quantification
current of 0.8 mA/cm for 1.5 h. of FN3K and Nrf2 protein bands was carried out using
2
Transfer efficiency was verified by staining the ImageJ (National Institutes of Health, Bethesda, USA). The
membrane with Ponceau S solution containing 0.2% in values were normalized to beta actin to account for loading
3% trichloroacetic acid and 3% sulfosalicylic acid. The variability, and the resulting relative expression levels were
positions of the molecular weight markers were marked on subjected to statistical analysis. 50
the blot before immunodetection. 48
2.3.2. Statistical tests applied
2.2.3.4. Western blot analysis and chemiluminescence detection Welch’s t-test was employed to evaluate treatment effects
The membrane was extensively rinsed with 1× PBS to by independently comparing each experimental group
eliminate residual Ponceau S stain, followed by a blocking with the untreated control group. This statistical test
Volume 9 Issue 3 (2025) 203 doi: 10.36922/EJMO025150114