
Page 79 - GHES-1-1
P. 79
Global Health Econ Sustain Clinician’s attitude toward health extension program
average of 5.3 years spent working in the healthcare sector. sending patients back to HP from their facility. Clinician
Degree holders constitute 50.6% of the total. More than readiness to collaborate in HEP accounts for 88.4%. The
three fourth (77.8%) were from health centers, and 51.5% decision to share additional tasks with HEW at HP, such as
of the respondents worked in rurally situated facilities. eye care, medical abortion, and hypertension screening, is
being debated by healthcare professionals. Clinicians were
3.2. Level of involvement, recommendation, and asked about task-sharing for the aforementioned activities.
willingness to support HEP As a result, 50.3% of clinicians approved of task-sharing of
The degree of clinician participation in the HEP was diabetes mellitus injection with HEWs at HPs, but 18.2%
assessed using three questions with dichotomous of them never approved of additional task-sharing to be
(Yes/No) answers: (i) Participation in HEP review cascaded into HP, as shown in Figure 1.
meetings; (ii) participation in HEP outreach activities; 3.3. EFA
and (iii) participation in HEP home visits. Any positive
responses to these questions meant the respondent had The 54 items had a sampling adequacy measure of
been exposed to HEP. According to the findings, 27.8% KMO = 0.97 (ranging from 0.93 to 0.98), indicating that
had no involvement in HEP. 64.6%, 45.2%, and 28% of the variables shared enough similarities to execute EFA. The
respondents, respectively, participated in HEP outreach, item questions demonstrated a normal distribution when
HEP review meetings, and home visits. Approximately graphically presented. The “factorability” was confirmed
1014 (83.8%) clinicians reported treating patients whom by Bartlett’s test of sphericity, and the null hypothesis was
2
HEWs had referred, and more than half (56.9%) reported rejected (p < 0.001 and χ [405] = 17886.4). These findings
supported the use of EFA based on the KMO, Bartlett’s
Table 1. Socio‑demographic characteristic of respondents, test of sphericity, and anti-image correlation. Four factors
clinician attitude in Ethiopia, 2019 with Eigenvalues greater than 1 were found using the EFA,
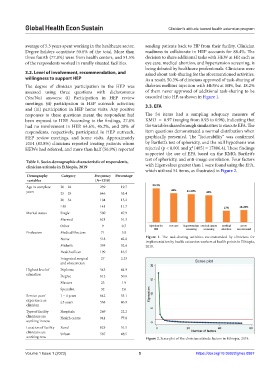
which utilized 54 items, as illustrated in Figure 2.
Demography Category Frequency Percentage
variables (N=1210)
Age in complete 20 – 24 239 19.7
years 25 – 29 646 53.4
30 – 34 184 15.2
≥35 141 11.7
Marital status Single 580 47.9
Married 621 51.3
Other 9 0.7
Profession Medical Doctors 71 5.9
Nurse 518 42.8 Figure 1. The task-sharing activities recommended by clinicians for
implementation by health extension workers at health points in Ethiopia,
Midwife 395 32.6 2019.
Health officer 199 16.5
Integrated surgical 27 2.23
and obstetrician
Highest level of Diploma 543 44.9
education Degree 612 50.6
Masters 23 1.9
Specialist 32 2.6
Service year/ 1 – 4 years 642 53.1
experience as ≥5 years 568 46.9
clinician
Type of facility Hospitals 269 22.2
clinicians are Health centre 941 77.8
working in now
Location of facility Rural 623 51.5
clinicians are Urban 587 48.5
working now Figure 2. Scree plot of the clinician attitude factors in Ethiopia, 2019.
Volume 1 Issue 1 (2023) 5 https://doi.org/10.36922/ghes.0887