
Page 82 - GHES-1-1
P. 82
Global Health Econ Sustain Clinician’s attitude toward health extension program
services to their community. On the other hand, 70.1% 40.5% of respondents believed that HEP lacked a good
of clinicians believe HEW could not offer safe abortion planning, monitoring, and follow-up system.
services.
3.6. Level of association
Fifteen items constitute the F2, which had a reported
mean score of 10.9 (SD = 4.3). An overwhelming majority A one-way ANOVA test was conducted on eleven
of clinicians (85%) were aware that HEWs offer nutritional predictors against the predicted factor. As illustrated in
counseling and screening for children. The respondents’ Table 4, all eleven variables show a significant relationship
item-specific knowledge ranged from 59% to 85%, with with F1. Thus, the null hypothesis was rejected. With
more than two-thirds (70.2%) having good knowledge of regard to F2, only one variable (service year) was
F2. The F3 composite score value has a mean score of 8.2 statistically insignificant. Only three variables showed a
(SD = 2.6) and a range from 0 to 10. The percentage of significant correlation with F3. All independent variables
clinicians who had a favorable attitude toward specific item significantly correlated with factors were entered into
questions ranged from 59.5% to 90.6%, and more than a multiple linear regression model to exclude possible
three-forth (76.2%) of clinicians had a favorable attitude confounders.
toward F3. The majority of respondents (90.6%) advocated 3.7. Multiple regression analysis
for the continuation of HEP as a government initiative,
and 88.7% believed that HEP had significantly reduced After confirming the normal distribution of the predicted
maternal and infant mortality in the country. However, factors, multiple regression analysis was performed.
Five of the eleven candidate predictors were statistically
2
Table 3. Outcome variables of clinician’s knowledge and significant for F1, at the full model report of r = 14%,
attitude outcome variables, in Ethiopia, 2019 F (16, 1184) = 12.00, and P = 0.001. Degree holders had
a lower average perception of F1 than diploma holders by
Name of outcome Classification Frequency Percent −0.28 (95% CI [−0.41, −0.15], P = 0.001). F1 was positively
variable (N=1210) (%) correlated with participation in HEP review meetings,
F1 (Clinician perceived Favorable attitude 914 75.5 outreach engagement activities, home visits, and those
attitude toward the skill Unfavorable attitude 296 24.5 who reported being willing to support HEP activities. As
of HEWs) the level of involvement in HEP review meetings increased,
F2 (Clinician Good knowledge 849 70.2 F1 also increased by 0.15 (95% CI [0.03, 0.27], P = 0.000).
knowledge of HEP Poor knowledge 361 29.8
activities) The F1 increased by 0.27 (95% CI [0.14, 0.40], P = 0.001) as
F3 (Clinician perceived Favorable attitude 922 76.2 HEP outreach engagement increased. A rise in home visit
attitude toward the Unfavorable attitude 288 23.8 participation also resulted in a 0.17 (95% CI [0.05, 0.30],
impact of HEP) P = 0.005) increase in F1. Clinicians willing to support
Abbreviations: HEP: Hospital extension program; HEW: Hospital HEP had an average F1 of 0.73 higher than those who were
extension worker. not (95% CI [0.56, 0.89], P = 0.001).
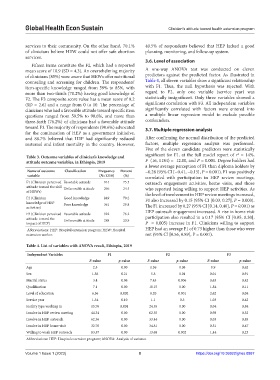
Table 4. List of variables with ANOVA result, Ethiopia, 2019
Independent Variables F1 F2 F3
F‑value p‑value F‑value p‑value F‑value p‑value
Age 2.5 0.00 1.36 0.08 0.9 0.62
Sex 1.56 0.21 5.8 0.01 0.01 0.91
Marital status 3.4 0.06 7.45 0.006 0.63 0.42
Qualification 7.1 0.00 10.15 0.00 1.84 0.11
Level of education 6.56 0.002 8.20 0.001 2.62 0.04
Service year 1.34 0.10 1.1 0.3 1.03 0.42
Facility type working in 15,76 0.001 24.35 0.00 0.04 0.84
Involve in HEP review meeting 44.34 0.00 62.35 0.00 0.98 0.32
Involve in HEP outreach 62.36 0.00 33.44 0.00 0.03 0.85
Involve in HEP home visit 32.76 0.00 34.81 0.00 0.51 0.47
Willing to work HEP outreach 83.57 0.00 13.68 0.002 1.44 0.23
Abbreviations: HEP: Hospital extension program; ANOVA: Analysis of variance.
Volume 1 Issue 1 (2023) 8 https://doi.org/10.36922/ghes.0887