
Page 102 - GHES-1-2
P. 102
Global Health Econ Sustain Burnout syndrome in the public and private sectors
for main symptoms ranged from 1.3 to 4.9 points with a symptoms dimension ranged from 1.0 to 4.8 points with a
mean value of 2.5 points (SD = 0.6 points). The psychological mean value of 2.4 points (SD = 0.8 points). The overall score
distress dimension ranged from 1.2 to 4.8 points with a mean for secondary symptoms ranged from 1.1 to 4.6 points with
value of 2.9 points (SD = 0.9 points). The psychosomatic a mean value of 2.6 points (SD = 0.8 points).
The Cronbach’s alpha for all dimensions exceeded
Table 1. Demographics characteristics of the surveyed 0.7, indicating acceptable reliability. Table 3 presents the
respondents burnout levels of the surveyed respondents based on the
Variable Ν % similar set of dimensions.
Gender Based on the exhaustion dimension, 5.4% of the
Male 41 36.6 participants were experiencing high levels of exhaustion,
Female 70 62.5 while the majority suffered from moderate exhaustion
Non-binary 1 0.9 (46.4%). The respondents who reported very high
Age levels of mental distance accounted for 7.1% of the
sample, and interestingly, the same percentages (7.1%)
18 – 39 54 48.2 of respondents also suffered from very high levels of
40 – 64 56 50.0 cognitive impairment and emotional impairment. Similar
65+ 2 1.8 to the exhaustion and mental dimension dimensions, the
Marital status majority of the participants claimed that they suffered
Single 68 60.7 from moderate levels of cognitive impairment (56.3%)
Married 44 39.3 and emotional impairment (58%), answered moderate.
Educational level In terms of secondary symptoms, 6.3% and 5.4% of the
participants stated that they experienced very high levels
Gymnasium/lyceum 16 14.3 of psychological distress and psychosomatic symptoms,
Post-secondary studies 15 13.4 respectively. Resembling the trend in their main symptoms
Bachelor’s degree 35 31.3 counterparts, more than half of the respondents suffered
Master’s degree 38 33.9 from psychological distress (50.9%) and psychosomatic
PhD/postdoc 8 7.1 symptoms (53.6%) at moderate levels. Full details in this
Current employment status regard are given in Table 3.
Freelancer 19 17.0 3.2. Measurement of mental resilience scale using BRS
Executive/employee in a position of responsibility 29 25.9 Table 4 presents the descriptive data on the mental resilience
Employee 64 57.1 scale. The scale ranges from 1 to 5 points. A higher value
Field of work indicates a higher level of mental resilience.
Public sector 28 25.0 The mental resilience score of the surveyed respondents
Private sector 84 75.0 ranged from 1.0 to 4.8 points with a mean of 3.2 points
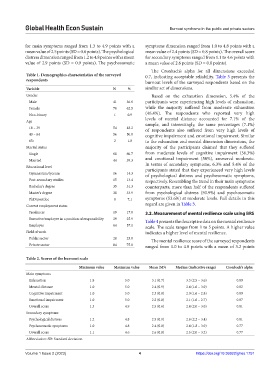
Table 2. Scores of the burnout scale
Minimum value Maximum value Mean (SD) Median (indicative range) Cronbach’s alpha
Main symptoms
Exhaustion 1.8 5.0 3.1 (0.7) 3.3 (2.5 – 3.6) 0.89
Mental distance 1.0 5.0 2.4 (0.9) 2.4 (1.6 – 3.0) 0.82
Cognitive impairment 1.0 5.0 2.3 (0.8) 2.0 (1.6 – 2.8) 0.89
Emotional impairment 1.0 5.0 2.2 (0.8) 2.1 (1.6 – 2.7) 0.87
Overall score 1.3 4.9 2.5 (0.6) 2.4 (2.0 – 3.0) 0.81
Secondary symptoms
Psychological distress 1.2 4.8 2.9 (0.9) 2.8 (2.2 – 3.4) 0.81
Psychosomatic symptoms 1.0 4.8 2.4 (0.8) 2.4 (1.8 – 3.0) 0.77
Overall score 1.1 4.6 2.6 (0.8) 2.5 (2.0 – 3.2) 0.77
Abbreviation: SD: Standard deviation.
Volume 1 Issue 2 (2023) 4 https://doi.org/10.36922/ghes.1751